
Archimedes’ On Floating Bodies already treats buoyancy and the stability of simple solids, but the stability of a ship of arbitrary shape could not be computed before the calculus. The modern theory was founded independently and almost simultaneously by Pierre Bouguer (Traité du navire, 1746), who introduced the metacentre, and Leonhard Euler (Scientia navalis, 1749), who expressed the criterion through the restoring moment. In 1748 François-Guillaume Clairain-Deslauriers, a junior constructor at Brest, inclined the newly built 74-gun ship Intrépide by hanging two 24-pounder guns, each of over two tonnes, from a buttress built on its side. The buttress broke, but he had already measured enough to find a metacentric height (the height of the metacentre above G) of 1.8 m. Unlike the men who ran across Vasa’s deck, he heeled the ship with known weights and measured the result, as the inclining experiment of Chapter 10 does today5,6.
Figures and tables have more room in landscape.
Chapter 1: Hull form and its description
Version 1.0 · last revised 6 November 2026 · corrections
Prologue: Vasa, Captain and Monarch
On 10 August 1628 the new warship Vasa sank in Stockholm at the start of its maiden voyage, watched by a crowd that had gathered on the waterfront to see it set out. Between four and five o’clock in the afternoon the quay below the royal palace was packed with people and the water was crowded with small boats, and members of the crew had brought their families on board. The ship was hauled along the waterfront on its anchors, four of its ten sails were set, and a salute was fired. Under the bluffs of Södermalm there was little wind, until a much stronger gust heeled it over on its port side. Water poured in through the open gunports of the lower gun deck, and within minutes it was on the bottom in 32 m of water. About thirty of those on board died1.
The danger had been seen before the ship sailed. Some weeks earlier its captain had arranged a demonstration for Vice Admiral Klas Fleming, in which thirty men ran back and forth across the upper deck to make it roll. After a few runs it was heeling so far that those watching feared it would capsize at the quay, and the test was stopped. Fleming was overheard to say, “If only His Majesty were at home!” The king was not at home, and the ship sailed as planned. At the inquest the master testified that he had ballasted the ship as deeply as it should be, and the investigation concluded that neither the ballast nor loose guns had caused the loss. The fault lay in the ship as built; one of the experts said that it did not have enough “belly” to carry its high and heavy upperworks. No one was punished; the builders argued that the king had approved the design2.
Two and a half centuries later the Royal Navy suffered a related failure, with a greater loss of life. In the early hours of 7 September 1870 its new warship HMS Captain, whose guns were carried in revolving turrets, capsized in a gale off Cape Finisterre. Eighteen men survived; by most counts 473 were lost, among them Captain Cowper Coles, on whose ideas the ship had been based3. It carried a full rig of masts and sails on a hull that stood low in the water, and it had come out heavier than designed.
The weakness of Captain was not entirely unforeseen. In the summer of 1870 the Admiralty asked one of its naval architects, Frederick Barnes, to work out how strongly the ship would right itself at each angle of heel. No such calculation had been made before for a major warship of the Royal Navy. Barnes sent a preliminary report on 23 August. It showed only a small margin of safety, but it was not passed on to the fleet, and a fortnight later the ship was gone3. Edward Reed, who had designed its near contemporary HMS Monarch with a much higher side, called the loss the “revenge” of science over politics3.
Twenty-nine years later Edward Lewis Attwood, an Assistant Constructor of the Royal Navy who lectured on naval architecture and wrote for students and draughtsmen, chose Captain and Monarch to explain what he called the curve of stability4. This curve, called the curve of righting levers in the chapters that follow, plots how strongly a ship rights itself against the angle to which it is heeled. Seen side by side, the curves of the two ships show why one capsized at an angle at which the other still had plenty in reserve. We will draw them and read them in Chapter 4 (Sec. 4.7.4), after the ideas they rest on have been built up one by one, and Chapters 8 and 11 show how such curves are used to judge the stability of ships today.
Vasa and Captain both floated upright in calm water, but neither could resist the heeling it met. Both losses were decided by two things fixed before the ships sailed: the shape of each hull, above the waterline as well as below it, and the distribution of weight on board. In this chapter we will say what a ship must do, and then describe its hull in a form that can go into a calculation.
In this chapter
By the end of this chapter you will be able to:
- distinguish moulded from extreme dimensions, and allow for the shell and appendages in the displacement;
- convert positions, heel and trim from other conventions to the ship-fixed axes used throughout;
- read a lines plan and its table of offsets, and find an error in the offsets;
- compute and cross-check the coefficients of form and a first estimate of displacement, and explain how they change with draught and why stretching the hull leaves them unchanged;
- find the volume and the centre of buoyancy at a level or trimmed waterline from section areas.
What it assumes. No earlier chapter is assumed. You need the integrals of calculus for areas, volumes and centroids, and the pressure of water at rest from introductory fluid mechanics.
A first reading. Sections 1.1 to 1.8 carry the main thread, including Sec. 1.5.6 on the lines of the Series 60 hull. Sections 1.5.4 and 1.5.5, on the splines, NURBS and meshes with which design software represents a hull, can wait for a second reading, as can the design trapezium of preliminary design in Sec. 1.8.2.
1.1 Requirements of a floating ship
A ship is built to carry people or cargo at sea, and whatever its size and purpose it has to do three things (Fig. 1.1). It has to float at the waterline for which it was designed while it carries its intended load, and it has to float upright. When the wind, the waves or a shift of cargo heel it over, within the conditions for which it is designed, it has to come back upright. It also has to keep the water outside in normal service and, if its hull is holed in a collision or a grounding, limit the flooding so that it stays afloat. Vasa and Captain floated upright but did not meet the second requirement, and once Vasa had heeled, its open gunports let the sea in. Whether a ship meets all three depends on the shape of its hull and on the way its weight is distributed on board.
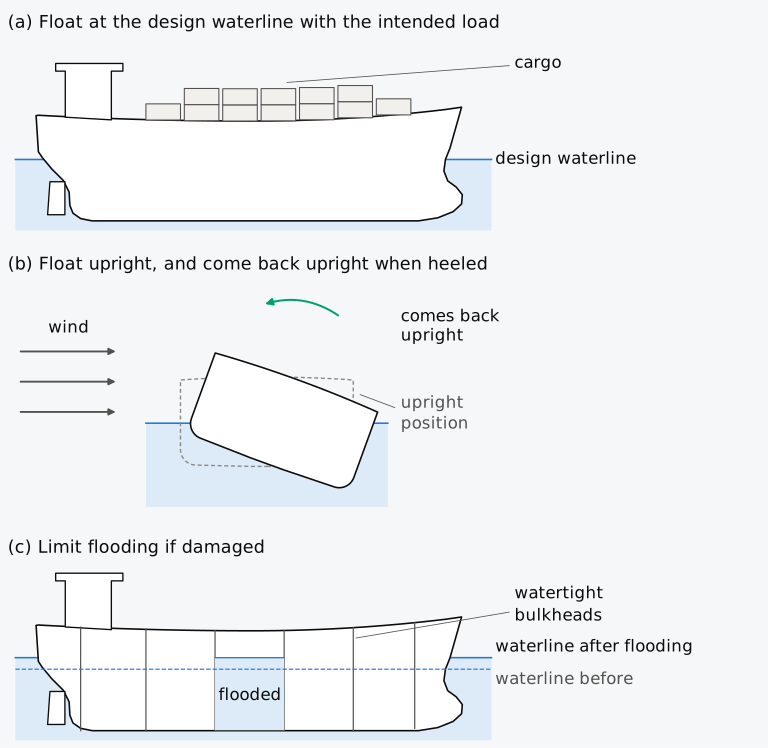
Figure 1.1 The three requirements of a floating ship. Sketches, not to scale; in (c) one compartment is flooded.
1.1.1 Weight and buoyancy
A ship floats because the water pushes up on the immersed part of its hull. Archimedes stated the principle: a body in a fluid experiences an upward force equal to the weight of the fluid it displaces. If the immersed part of the hull has volume (the displacement volume, read “nabla”) and the water has density , this upward force is , where is the acceleration due to gravity. It is called the displacement , and a ship floating freely has a displacement equal to its weight :
Here is the whole volume of water displaced, shell plating and appendages included. From Sec. 1.2.5 on, is the volume of the moulded hull, without the shell and the appendages; their volume, about 1 % of it, is added as an allowance when the weight of a real ship is equated to its buoyancy. The weight is fixed by what is built and what is loaded, while depends on the shape of the hull and on how deep it sits, so the ship sinks until it displaces its own weight of water. The depth at which this happens, its draught, is set by the shape of the hull. Captain, built heavier than designed, sank in this way until its displacement equalled its weight, and at its launch it floated more than 0.6 m deeper than designed3. Predicting the draught requires the immersed volume of the hull at any waterline.
Weight and buoyancy must also act along one line. The weight of a ship is spread over its hull, machinery, cargo, fuel and people, but for the balance of the whole ship it can be taken to act at one point, the centre of gravity G (Fig. 1.2(a)). G is the mean position of all the masses on board, each counted in proportion to its mass, so cargo stowed high on deck raises it and fuel in the double bottom lowers it. The buoyancy is the total of the water pressure on the immersed hull, which acts normal to the hull at every point and grows with depth. This total acts upwards through the centre of buoyancy B, the centroid of the immersed volume (Fig. 1.2(b)), which is also the centre of gravity of the water that the hull displaces.
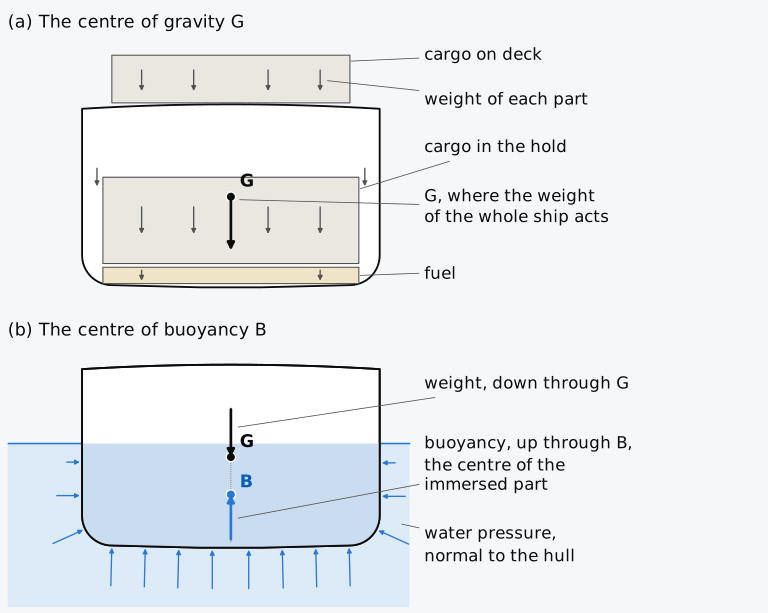
Figure 1.2 The centres of gravity and buoyancy of the whole ship, shown on a midship section: (a) the weights of the parts and G; (b) the ship afloat and B. A sketch, not to scale.
If G and B are not on one vertical line, the two equal and opposite forces form a couple that tends to heel or trim (incline fore and aft) the ship. For the ship to be at rest, two conditions must hold: , and G and B on one vertical. G depends on the masses on board and on where they are placed, and B only on the shape of the immersed hull. Chapter 3 treats weight, buoyancy and flotation in full, and Chapter 4 the stability that follows from the positions of G and B.
1.1.2 Stability of equilibrium
A ship that satisfies both conditions can still capsize, as Vasa did. Equilibrium may be stable, neutral or unstable, and the top row of Fig. 1.3 shows the three cases for a ball. A ball in a bowl that is displaced sideways rolls back to the bottom; a ball on a level table stays where it is put; a ball on a dome rolls away. The classification depends on whether the forces arising from a small disturbance return the system to its original position, leave it in the new position, or move it further away.
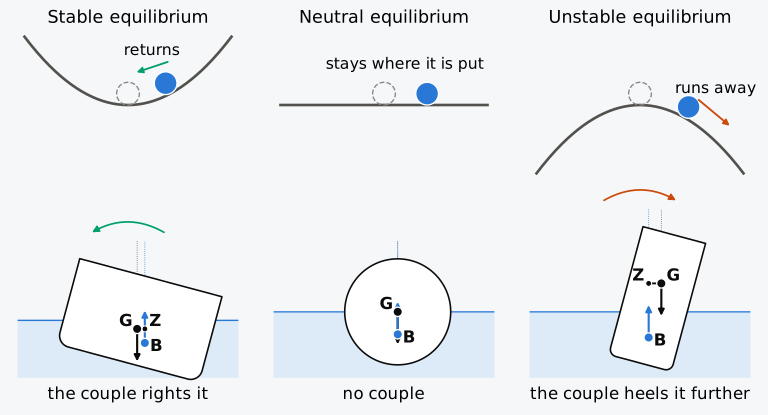
Figure 1.3 Stable, neutral and unstable equilibrium: a ball, and three floating sections heeled 15° to starboard, seen from aft.
For a ship the relevant disturbance is a small heel. As long as nothing on board moves, G stays fixed relative to the hull, but B moves: one side of the hull rises out of the water, the other side is immersed further, and the centroid of the immersed volume moves towards the side that went down. Buoyancy and weight remain equal, but they no longer act along one line, and they form a couple whose moment, the righting moment, is
where Z is the foot of the perpendicular from G to the line of action of the buoyancy (Fig. 1.3). GZ, the horizontal distance between the two lines of action, is the righting lever. If B has moved further outboard than the vertical through G, the couple turns the ship back towards upright and the ship is stable. If B has moved less far, the couple heels the ship further. The levers of Captain and Monarch that Attwood drew as curves are values of GZ, one at each angle of heel.
The bottom row of Fig. 1.3 shows the three possibilities. A wide, shallow section with a low G is stable, because a small heel moves B a long way outboard. A circular section is a special case. Water pressure acts normal to the surface, and every normal to a circle passes through its centre, so the buoyancy force passes through the centre at any angle of heel. If G is at the centre there is never a couple, and the section is in neutral equilibrium like the ball on the table. A tall, narrow section with a high G is unstable; B moves little, the vertical through B stays on the inboard side of G, and the couple heels the section further. Whether a ship floats upright depends on two quantities, how far the shape of the hull allows B to move when the ship heels and how high the loading has placed G. Bouguer expressed this comparison in 1746 through the point he named the metacentre5. For small heels the metacentre is a point above B whose height above B is fixed by the shape of the waterplane and the volume displaced, and the ship is stable at small heels as long as G lies below it (Sec. 4.4).
Historical note: Archimedes and Bouguer
Historical note: Chapman and Atwood
The Swedish constructor Fredrik Henrik Chapman made the calculation of displacement and metacentre a routine part of design, using Simpson’s first rule (Sec. 2.3), which Thomas Simpson reportedly taught him. In 1796 George Atwood extended the analysis to large angles of heel. He showed that the initial stability (a ship’s resistance to small heels) is not a sufficient measure and that stability must be judged over a range of angles. In a second paper, of 1798, written with the French constructor Vial du Clairbois, the term GZ was introduced for the righting lever, and the righting moments of actual ships were computed over a range of heel. Such calculations took several more decades to become routine5,6. The mathematician George Atwood is not Edward Lewis Attwood, whose textbook of 1899 supplies the righting levers of Captain and Monarch and several of the examples and exercises.
Ships at sea are seldom at rest. The static model of hydrostatics, in which the ship is heeled slowly and the forces are examined at rest, is a deliberate simplification of a dynamic problem. It is useful because the static righting lever underlies every stability assessment, but it remains a model. Chapter 9 adds the energy balance of a ship struck by a gust and the change of the righting lever in waves, and Chapter 11 the second generation intact stability criteria, which assess failures of stability in waves.
1.1.3 Degrees of freedom and hydrostatic restoring
A floating ship has six degrees of freedom (Fig. 1.4): translation fore and aft (surge), sideways (sway) and vertically (heave), and rotation about a longitudinal axis (roll), a transverse axis (pitch) and a vertical axis (yaw). Hydrostatic forces oppose only three of these motions. Pushing the ship down increases its buoyancy, so heave has a restoring force; heeling or trimming a stable ship produces a righting moment, so roll and pitch have restoring moments. Moving the ship sideways or forwards, or turning it in yaw, does not change the hydrostatic pressure on the hull, and nothing restores it. Hydrostatics is concerned with sinkage, heel and trim, the steady counterparts of heave, roll and pitch, whose signs are defined in Sec. 1.3.2.
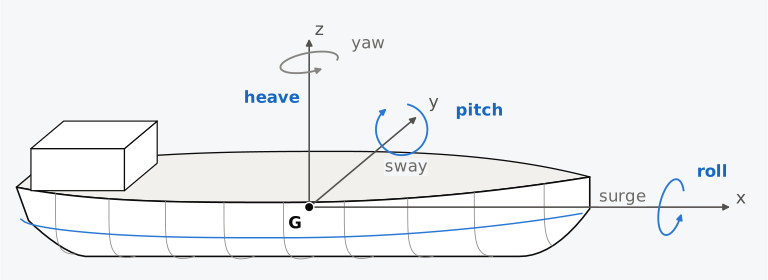
Figure 1.4 The six degrees of freedom, about axes through G parallel to the ship’s axes. Hydrostatic forces and moments respond only to the motions in bold blue: heave, roll and pitch.
1.1.4 Watertight integrity and reserve buoyancy
Buoyancy is provided only by volume that the sea cannot enter. Vasa sank because its heel brought open gunports to the water, after which the sea filled the hull. A ship keeps the water out first by being watertight, through its shell, its decks and the closures of its openings. It also needs reserve buoyancy: watertight volume above the waterline that comes into play when the ship heels, is pressed down by a wave or takes on water. Freeboard, the vertical distance from the waterline to the deck at the ship’s side, is the visible measure of reserve buoyancy, and Captain, low in the water, had little of it. Because no hull is proof against collision or grounding, a ship is also divided by watertight bulkheads, which can confine flooding to part of it (Fig. 1.1(c)). The ship then floats deeper and may heel or trim. Sufficient intact volume is needed to remain afloat; whether the damaged ship stays stable also depends on where that volume and the ship’s weight lie. Damage stability is treated in Chapter 12.
1.1.5 Organization of the book
The chapters are arranged by the three requirements (Fig. 1.5). Chapters 1 and 2 describe the hull and show how to integrate over it, and Chapter 3 deals with flotation. Chapters 4 to 9 deal with keeping the ship upright: initial stability and the metacentre, the effect of moving weights, trim, the hydrostatic curves that collect these quantities, stability at large angles, and the heeling moments a ship must resist. Chapters 10 and 11 deal with verification: the inclining experiment, which measures the position of G, and the criteria that regulators require. Chapter 12 deals with remaining afloat and stable after flooding, and Chapter 13 with ships partly supported by the ground, a dock or a slipway. Chapter 14 turns to craft whose waterplane or means of support differs from that of a conventional ship: multihulls, submarines and submersibles, high-speed craft and offshore units.
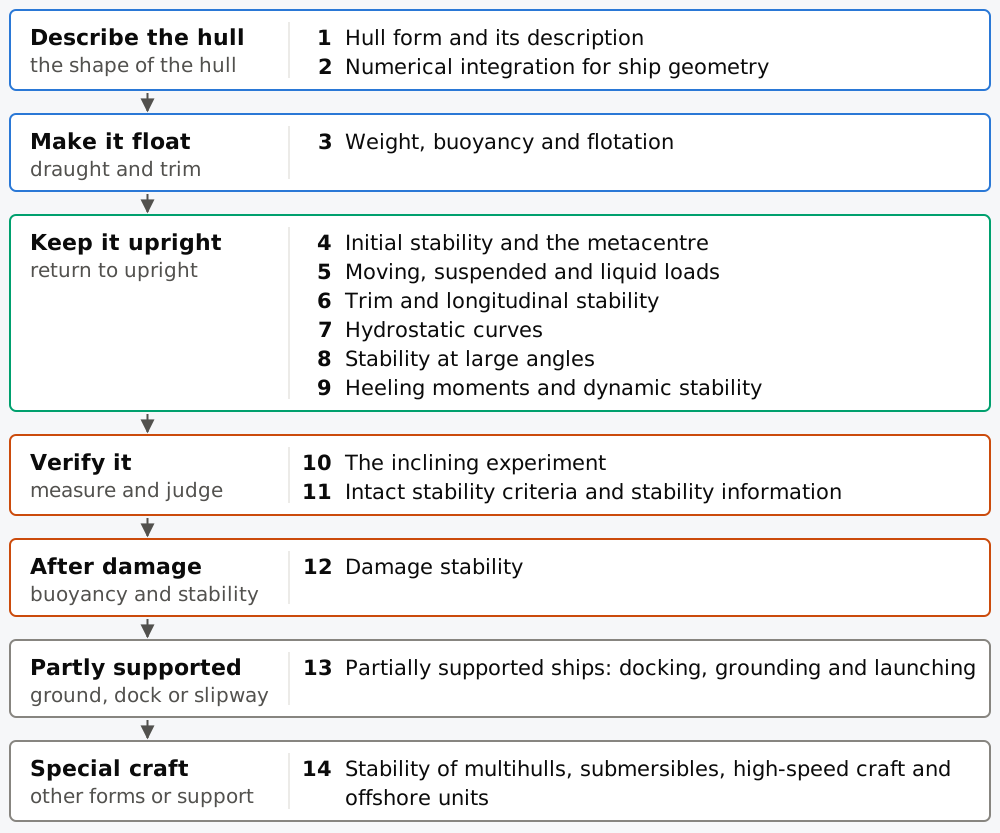
Figure 1.5 The chapters, grouped by the requirement they serve or the case they treat.
Each of these topics requires integrals over the shape of the hull. The displacement is a volume integral over the immersed hull and B is its centroid; how far B moves when the ship heels depends on the shape of the waterplane (the area that the waterline encloses) and, at large angles, on the shape of the hull above water as well. These integrals need a description of the hull from which they can be computed. That description begins with the terms in which a hull is measured, its principal dimensions and the features of its form, and with the axes in which positions on it are given.
1.2 Principal dimensions and features of the form
A ship has several lengths, and its breadth, depth and draught can each be measured to more than one surface. The principal dimensions and the features of the form are drawn in Fig. 1.6.
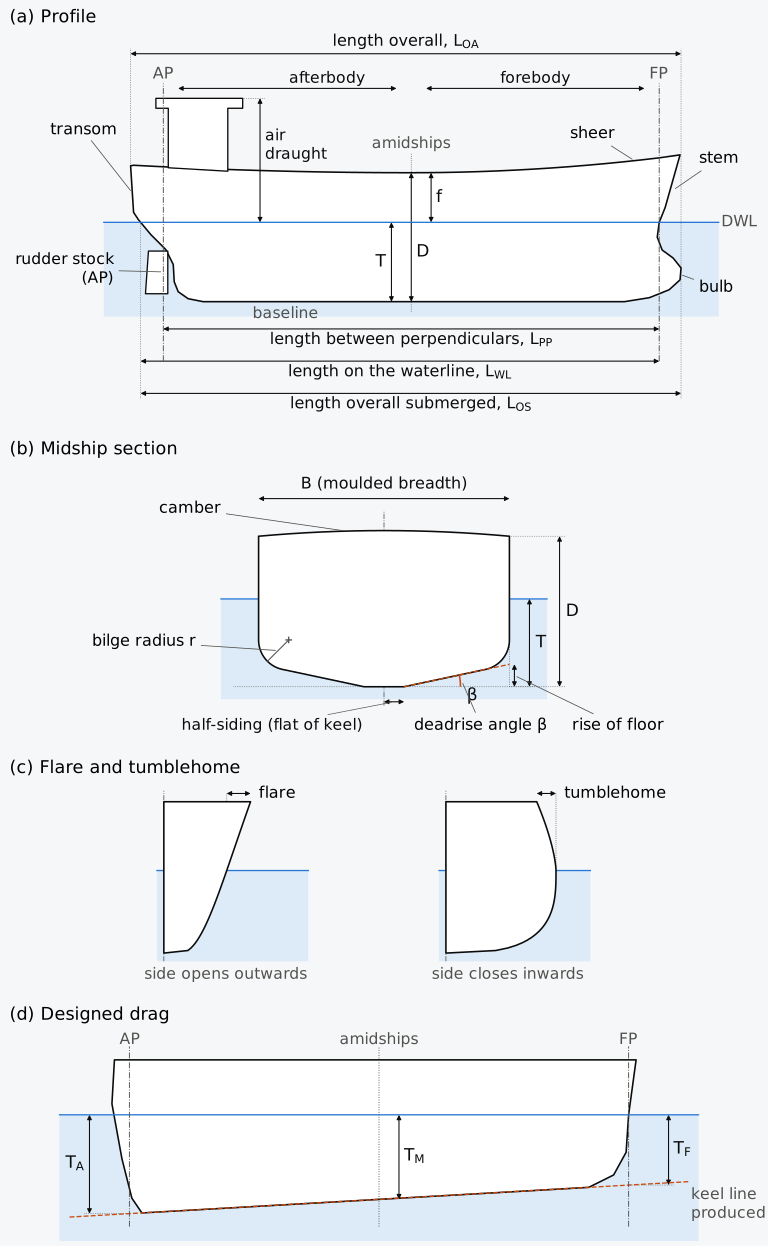
Figure 1.6 Principal dimensions and features of the form: (a) profile; (b) midship section, with the deadrise exaggerated; (c) flare and tumblehome; (d) draughts of a ship with designed drag, heights exaggerated. Sketches, not to scale.
1.2.1 Reference lines
Heights are measured from the baseline, and the design waterline is the reference waterline (Fig. 1.6(a)). The design waterline (DWL) is the waterline for which the ship is designed. ISO 7462 recommends as the reference the designed summer load waterline, the waterline up to which the ship may be loaded in sea water in summer (Sec. 3.7), and it is kept as the datum even when the actual load waterline changes in later design or in service7. The baseline lies in the centreplane, the plane of symmetry of the hull, parallel to the DWL. It is placed at the bottom of the moulded surface, the inside of the shell plating to which the hull is designed and built, and on most ships with a straight keel that is the top of the flat keel plate; every height of the hull is positive7,8. A ship floats on even keel when its keel, or its baseline, is parallel to the water surface7,9; for a ship whose keel is not straight or not parallel to the DWL, the International Towing Tank Conference (ITTC) prefers the terms zero trim or level trim.
1.2.2 Perpendiculars and lengths
Lengths are measured between two reference lines at the ends of the ship, the perpendiculars. The forward perpendicular (FP) is the vertical line through the point where the fore side of the stem meets the DWL. The aft perpendicular (AP) is at the after side of the rudder post (the vertical member of the structure on which the rudder is hung), if the ship has such a post; merchant ships without a well-defined rudder post customarily take the axis of the rudder stock, the shaft through which the rudder is turned. In naval practice, and sometimes in merchant ships whose submerged stern extends well abaft the rudder, the AP is at the after end of the DWL8,9. Strictly, the FP so defined lies on the outside of the stem plating, a small inconsistency with the moulded dimensions8.
The length between perpendiculars, , is the distance from the AP to the FP, and it is the reference length unless stated otherwise. The length on the waterline, , is the length of the waterline at which the ship floats, taken at the DWL unless qualified. The length overall, , is measured between the extreme ends of the hull and is the length a harbour master asks for. The length overall submerged, , is the greatest length of the hull below the DWL, measured parallel to it7; when a bulb projects forward of the point where the stem meets the waterline, as in Fig. 1.6(a), it exceeds . The position halfway between the perpendiculars is amidships, and the section there is the midship section, which drawings mark with a symbol that differs between English and German practice7. The parts of the hull forward and aft of amidships are the forebody and the afterbody9.
Rules and regulations define lengths of their own. The 2008 Intact Stability Code (IS Code), for example, takes the larger of two values on a waterline at 85 % of the least moulded depth: 96 % of the length of that waterline, or the distance from the fore side of the stem to the axis of the rudder stock10. Such lengths are introduced where they are used.
1.2.3 Breadth, depth, draught and freeboard
The moulded breadth is the breadth of the hull amidships, measured to the moulded surface. The ITTC takes it at the design waterline unless otherwise defined9, and the IS Code takes the maximum breadth amidships10; for a wall-sided ship the two are equal. is the greatest breadth on the waterline, and the breadth at the section of largest immersed area. The moulded depth is the vertical distance from the baseline to the moulded line of the uppermost continuous deck at the side, amidships; the IS Code measures it to the freeboard deck, the deck to which freeboard is measured9, and adds rules for rounded gunwales and similar details10.
The moulded draught is the vertical distance from the baseline to the waterline, measured amidships unless qualified. and are the draughts at the AP and FP, and is the draught amidships11. For a rigid hull with a straight keel the waterline is a straight line along the hull, and then
and the midship draught of such a hull is often called the mean draught. A real hull bends under its loads, and a hull that sags (deeper amidships) or hogs (shallower) has a midship draught that differs from the mean of the end draughts; the difference is the amount of sag or hog12. Section 3.6.1 shows how it is found from the draught marks and allowed for in finding the displacement. A quoted “mean draught” may be either quantity, and the source should make clear which.
Those who sail the ship also use the keel draught, measured to the underside of the keel, and the navigational draught, measured to the deepest point of the ship, including appendages such as a sonar dome or a propeller blade tip8,13. The air draught is the height of the highest point of the ship, usually the top of a mast, above the waterline (Tupper measures it from the summer waterline); it determines whether the ship can pass under a bridge12.
The freeboard is, geometrically, the height of the deck at side above the waterline amidships, , and a ship that floats deeper than designed has less freeboard than designed. Captain’s extra draught, more than 0.6 m at its launch by one account, came off a freeboard that was low by design; Monarch’s freeboard was about twice as large, and Sec. 4.7.4 compares the sources. As we have seen, freeboard is the visible measure of reserve buoyancy. The statutory freeboard, which load-line rules require a ship to keep, is a regulated quantity of its own, and Sec. 3.7 explains how it is assigned and how the load line mark shows it.
1.2.4 Features of the form
A few more terms describe the shape. Sheer is the rise of the deck at side towards the ends of the ship (Fig. 1.6(a)), and camber, or round of beam, is the rise of the deck at the centreline above the deck at side; about 2 % of the breadth was standard practice8. In the midship section (Fig. 1.6(b)) the bottom is often not horizontal. Near the keel there may be a flat, whose half-width is the half-siding; from its edge the bottom line rises at the deadrise angle to the horizontal9. The rise of floor, also called deadrise, is a height: that of the point where the bottom line, produced, meets the vertical at the half-breadth8,9. The turn of the bilge joins bottom and side, often along a circular arc whose radius is the bilge radius; a small radius makes a hard bilge and a large radius an easy bilge8. Above the waterline, sides that open outwards have flare, and sides that close inwards have tumblehome (Fig. 1.6(c)). Each is measured horizontally at the deck, as the distance of the side from the vertical through the widest point of the underwater hull8; Tupper gives tumblehome as half the difference between the breadth at the waterline and that at the upper deck12. Flare is common forward, where it helps to keep the deck dry in a seaway8.
Along the length, the parallel middle body is the part over which the sections are identical, and the tapering parts forward and aft of it are the entrance and the run11, of lengths and . A bulb is a swelling of the hull below the waterline, usually at the forward end just above the keel, and a transom is a flat or slightly convex transverse surface in which the stern ends abruptly9; the profile of Fig. 1.6(a) has both.
1.2.5 Moulded and extreme dimensions
A steel or aluminium hull is built by fitting plates to a framework of frames, floors and longitudinals. The designer draws, and the shipyard builds to, the surface on which the frames stand, which is the inside of the shell plating. That surface is the moulded surface, and dimensions measured to it are moulded dimensions (Fig. 1.7).
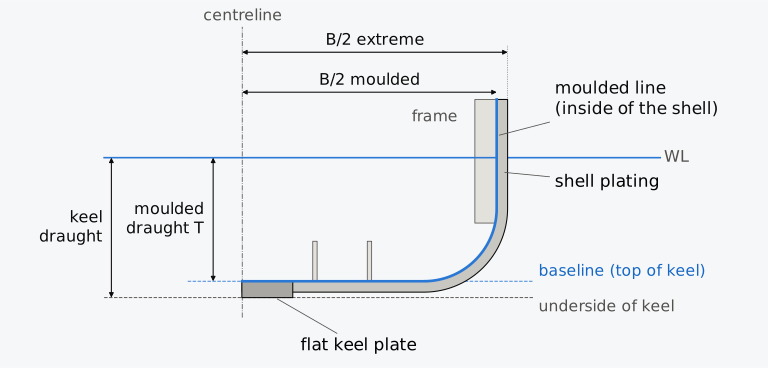
Figure 1.7 Moulded and extreme dimensions of a steel hull. A sketch; plate thicknesses are exaggerated.
Dimensions measured to the outside of the shell are called extreme. For hulls of glass-reinforced plastic the moulded surface is the outer surface8. Wooden boats are a special case: their moulded surface is the inside of the planking, but because planking is thick their lines are usually drawn to its outside8. The ITTC Dictionary refers hulls of wood, plastic, cement and other non-plated construction to the outer surface9, and the IS Code measures moulded breadth to the moulded line of the frame for a metal shell and to the outer surface for a shell of any other material10.
The difference matters most for volume. The moulded volume excludes the shell plating and the appendages: rudder, bilge keels, propeller boss and sonar dome. In a steel single-screw cargo ship these together usually add slightly less than 1 % to the moulded volume, of which the shell accounts for about 0.75 %; in a large tanker they add less than 0.5 %, and in multi-screw ships more8. Biran and López-Pulido7 quote allowances of about 0.8 % for vessels of a few hundred tonnes and 0.5 % for larger vessels. Unless stated otherwise, dimensions and volumes are moulded, and is the displaced volume of the moulded hull; when the weight of a real ship is equated to its buoyancy, the shell and appendage allowance is added to it. When data are compared, dimensions given without qualification may be measured to different surfaces: Tupper12 uses dimensions to the outside of the plating by default, while the ITTC takes breadth “when not otherwise defined” as moulded9. The term “moulded displacement” also differs between sources: the ITTC Dictionary includes the submerged appendages in the moulded displacement volume9. Hamlin8 and Biran and López-Pulido7 exclude them.
1.2.6 Draught marks
At sea, draughts are not measured at the perpendiculars. They are read from draught marks painted on the hull near the ends and amidships, placed as close to the perpendiculars as practicable8. The International Convention for the Safety of Life at Sea (SOLAS) requires every ship to have scales of draughts marked clearly at the bow and stern, and a reliable draught-indicating system where the marks are not easily readable14. Because the crew read them, the marks are meant to show keel draughts8, and the bottom of each figure is at the draught it indicates. Their datum must still be checked on each ship, because marks may be set above another baseline, especially where the keel is not parallel to the design waterline13. Imperial marks were traditionally figures 6 inches (152 mm) high at every foot (0.305 m). For metric marks Hamlin8 recommends the practice of the Australian authorities: figures one decimetre high, whole metres marked with the number followed by M, and the even decimetres in between marked 2, 4, 6 and 8 only. The form of the marks for a particular ship is set by its flag state and classification society, and Fig. 1.8 shows where the forward marks stand and how metric marks are read.
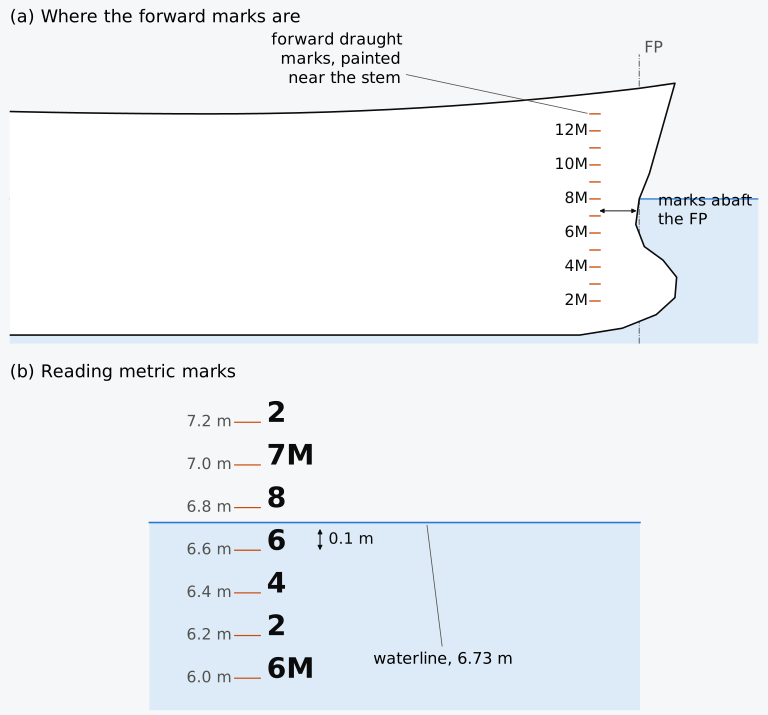
Figure 1.8 Draught marks: (a) where the forward marks are; (b) reading metric marks. A sketch.
In Fig. 1.8(b) the waterline lies just above the top of the figure 6, whose lower edge marks 6.6 m and whose top marks 6.7 m, and below the foot of the 8 at 6.8 m, so the reading is about 6.73 m. This reading is a keel draught at the marks, which are not at the perpendicular, and so it is neither a moulded draught nor, on a trimmed ship, the draught . Chapter 6 shows how readings at the marks are reduced to moulded draughts at the perpendiculars, which is what hydrostatic data require.
1.3 Axes and sign conventions
None of the descriptions so far states from which origin a point is measured or which directions are positive, and textbooks differ on these conventions more than might be expected.
1.3.1 Ship-fixed axes
We use a right-handed set of axes fixed in the ship (Fig. 1.9). The origin O lies where three planes meet: the baseplane, the horizontal plane through the baseline at the bottom of the moulded hull; the centreplane, the ship’s plane of symmetry; and the transverse plane through the aft perpendicular (AP). From O, the -axis points forward, the -axis to port and the -axis up.
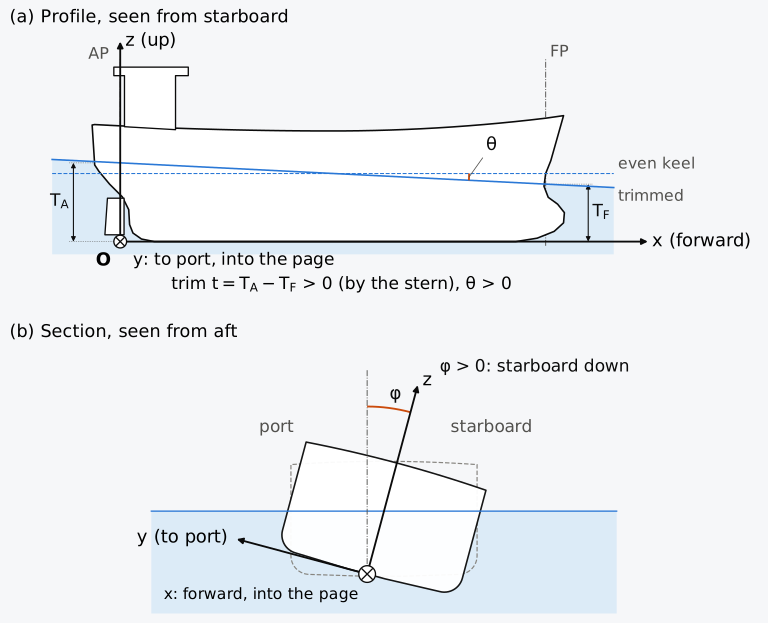
Figure 1.9 The ship-fixed axes, and the positive senses of trim and heel.
These are the directions of the ITTC body axes9; with the origin at the AP they are also the axes that the German standard DIN 81209-1 recommends7. Every point of the hull between the perpendiculars has a positive longitudinal coordinate, and longitudinal positions are given as -coordinates measured forward from the AP: , and denote the longitudinal centres of buoyancy, flotation and gravity (LCB, LCF and LCG; the centre of flotation F is the centroid of the waterplane), and the midship section is at . Heights are -coordinates above the baseline, so KB, the height of the centre of buoyancy above the keel point K on the baseline, is . For dynamics the ITTC uses a different frame, with its origin at G, to starboard and downwards; the positive senses of heel and trim defined below agree with positive roll and pitch in that frame.
The words port and starboard are older than any of these conventions. Before ships had rudders on the centreline, they were steered with an oar over the right-hand side near the stern, since most sailors were right-handed. That side became the steering side, from the Old English stéor (steer) and bord (side of a boat), which gave starboard. The other side, which had to lie against the quay, became the loading side, larboard, later replaced by port because larboard was too easily confused with starboard15. A ship’s sides keep their names whichever way an observer faces. Unless a figure states otherwise, sections are drawn as seen from aft, so port is on the left.
1.3.2 Heel and trim
Heel is a rotation about the -axis, positive when the starboard side goes down (Fig. 1.9(b)). This is a right-handed rotation about : turning , which points to port, towards lifts the port side. Steady inclinations about the -axis are named here by their cause. Heel in the narrower sense is caused by an external moment, such as wind or a turn; list by the ship’s own load being off-centre, or by asymmetric flooding; and loll is the angle at which a ship that is unstable when upright finds equilibrium, to one side or the other (Sec. 4.9). Roll is the oscillation about the -axis. All are measured by . Usage varies: the ITTC Dictionary treats heel and list as one term for any steady inclination, as distinct from rolling9, and Biran and López-Pulido7 call an inclination a heel if it is temporary and a list if it is permanent.
Trim is the difference between the draughts at the two perpendiculars,
positive when the ship is deeper aft, which is called trim by the stern; is the trim angle, with the sign of . This is the convention of the ITTC Symbols and Terminology List11. The ITTC Dictionary of Hydromechanics, however, defines trim with the opposite sign9, as . Textbooks are divided between the two signs: Biran and López-Pulido7 take trim by the head as positive, and Barrass and Derrett16 trim by the stern. A positive means bow up. In the ITTC dynamics frame that is a positive pitch; in our frame it is a negative rotation about , because a right-handed rotation about an axis pointing to port puts the bow down. This sign matters in any code that rotates a hull.
The floating position is described in axes fixed in space, , and , which coincide with the ship’s axes in a chosen initial position, upright and on even keel. A change of draught moves the ship’s axes vertically relative to them, and a heel or a trim rotates the ship’s axes7. When the ship heels through about its -axis, a point with ship coordinates lies at
and when it trims through about its -axis, a point lies at
With positive a point of the baseplane on the port side ( = 0, > 0) rises, and with positive a point of the keel forward of O rises, as the conventions above require. At a heel of 20°, for example, the port deck edge amidships of a hull 10 m wide and 10 m deep, at = (5, 10) m, lies at = 1.278 m and = 11.107 m. A heel or a trim about any other axis parallel to these differs only by a translation.
Some ships, among them tugs and fishing vessels, are designed with a keel that is straight but not parallel to the DWL7. The keel then usually slopes down aft, and the difference between its heights at the two perpendiculars is the designed drag; the baseline marks the bottom of the moulded surface amidships or at the AP8. The draughts and are measured from the keel line produced to the perpendiculars7 (Fig. 1.6(d)), so a ship with drag floating at a level waterline has equal to the drag. For this reason the ITTC Symbols List subtracts the designed drop of the keel line from to obtain the static trim11.
1.3.3 Displacement as a force and as a mass
Most stability texts use for a mass in tonnes, but the ITTC Symbols List11 defines as a force, , and the corresponding mass as . The ITTC definitions are used here, which makes Eq. (1.1) a balance of forces. In practice masses and mass moments (t, t·m) are used for weight tables and centres of gravity, and forces and their moments (kN, kN·m) wherever a force balance or a moment of forces is meant, as in the righting moment. Unless stated otherwise, sea water has density 1025 kg/m³, fresh water 1000 kg/m³, and = 9.81 m/s².
1.3.4 Converting from other conventions
Data taken from sources with other conventions must be converted before they enter a calculation, and Table 1.1 lists the common cases.
Table 1.1 Converting data from other conventions (ship of length ).
| Source convention | Its value | Converted value |
|---|---|---|
| position forward of amidships (+ forward) | ||
| position aft of amidships (+ aft) | ||
| position forward of the AP | ||
| position aft of the FP | ||
| transverse position, positive to starboard | ||
| depth below a waterline at draught | ||
| heel positive with the port side down | ||
| trim positive by the head |
Example 1.1. Converting conventions. A hydrostatic table (a table of the volume, the centres and related quantities of a ship at a series of draughts, treated in Chapter 7) for a ship with = 120 m gives “LCB = 2.35 m” in a convention where positions aft of amidships are positive, and “trim = −0.60 m” in a convention where trim by the head is positive. Express both as and .
1.4 The reference hulls
The integrals for the displacement and its centre have to be evaluated on some hull, and three hulls serve for that in this chapter and in every chapter after it. Figure 1.10 shows them; each is chosen for a different purpose. All three are bare moulded surfaces, without shell plating, appendages or designed drag, and the displacement volume of each is therefore the volume of its moulded hull below the waterline.
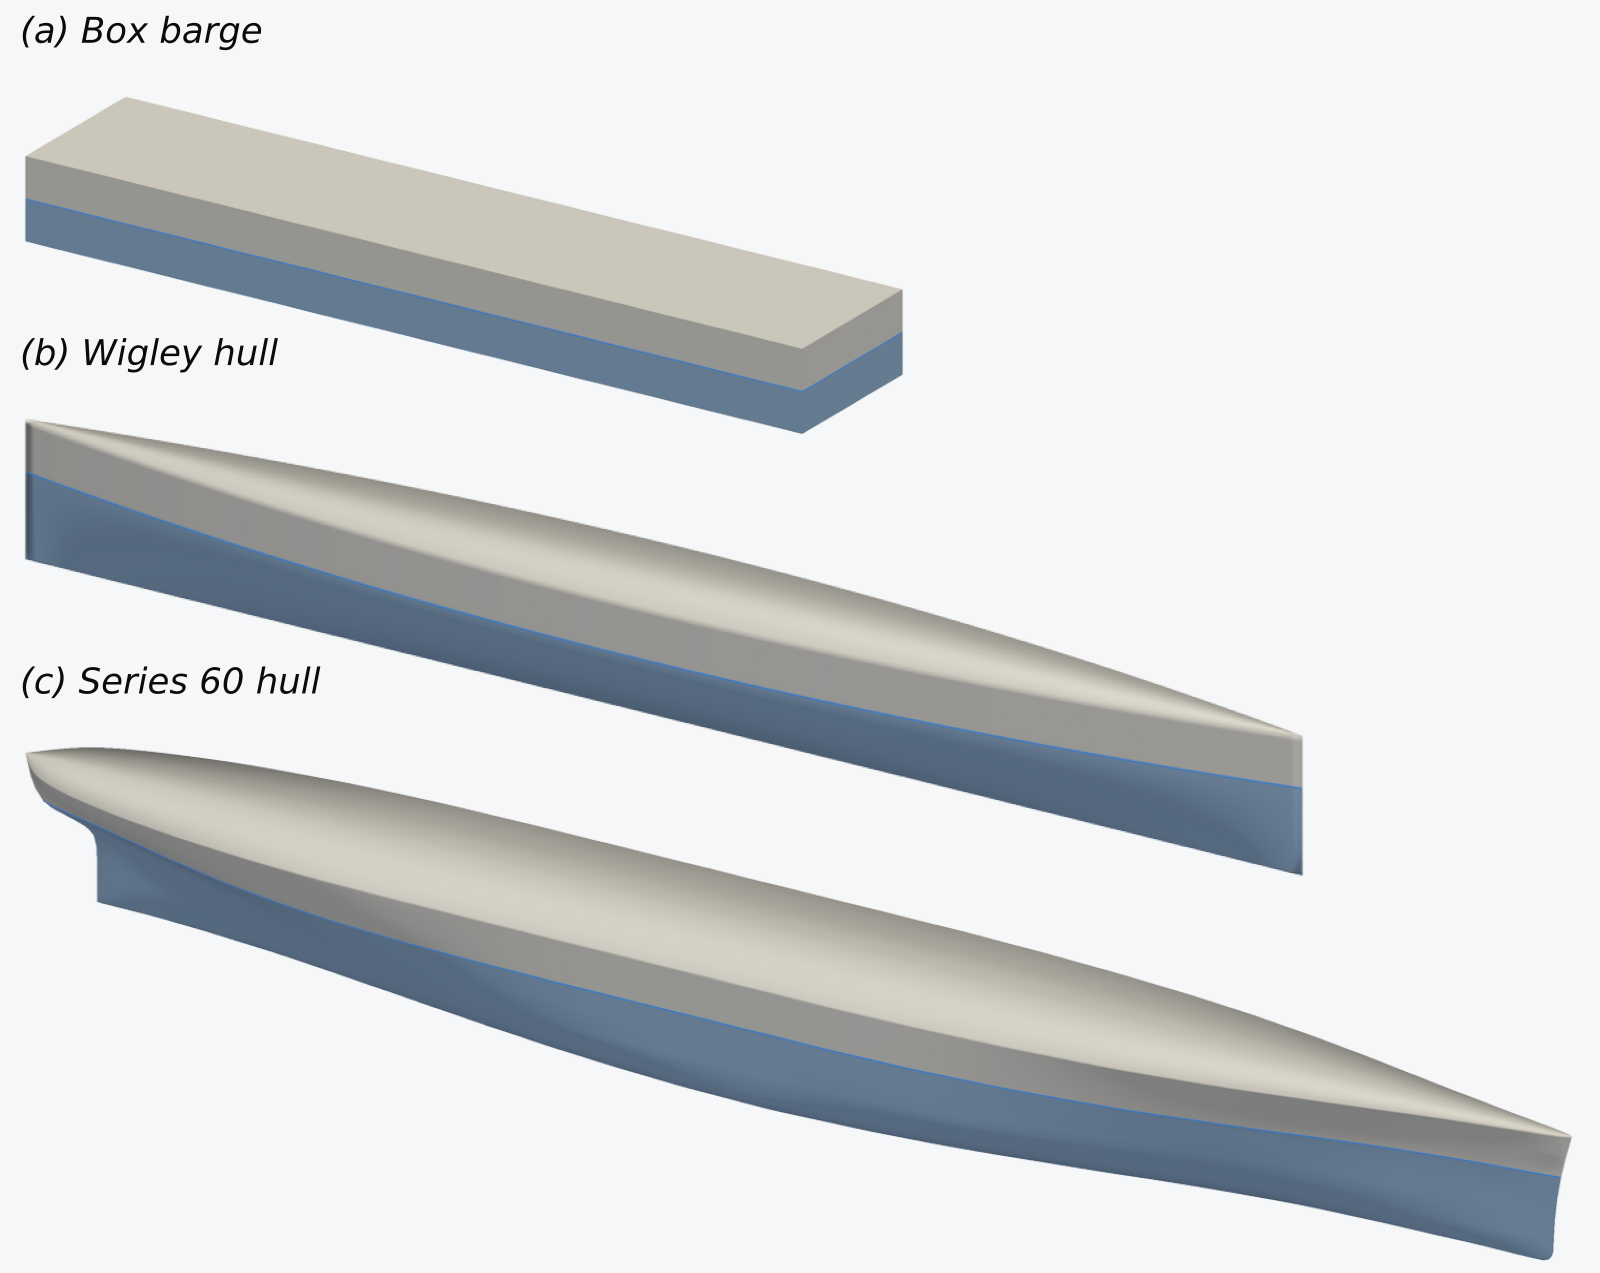
Figure 1.10 The three reference hulls, each drawn to its own scale; the part below the waterline is blue.
The box barge is a rectangular box floating upright. All of its properties can be written down directly: its volume is length × breadth × draught and its centre of buoyancy is at half the draught, and later chapters show that its metacentre, and its righting lever up to the angle at which the deck edge is immersed or the bottom emerges, have closed forms too. Because its geometry is trivial, any unexpected result for the box can be attributed to the physics. The box is also a standard first example in the stability literature (for example, Barrass and Derrett16). Its dimensions change from example to example; the box in Fig. 1.10 is 60 m long, 12 m wide and 6 m deep, floating at a draught of 3 m.
The Wigley hull is a mathematical hull: a smooth, ship-like form defined by a single formula. Hulls defined by formulas are older than computers. As early as 1760 Chapman described waterlines and sections by curves of the form , in non-dimensional coordinates7, and in 1915 D. W. Taylor wrote that practically all ships designed for the United States Navy in the previous ten years had mathematical lines8. Wigley17 used a hull with parabolic waterlines to compare measured and calculated wave resistance. The form now known as the Wigley hull, with parabolic waterlines and parabolic sections, a length–breadth ratio of 10 and a breadth–draught ratio of 1.6, became a standard benchmark through the cooperative experiments proposed by the Resistance Committee of the ITTC in the early 1980s18. Modified versions of it have been tested for seakeeping19. It is curved like a real ship, but its hydrostatic properties can still be found exactly, and the error of the numerical integration methods of Chapter 2 can be measured on it. The version used here is 100 m long, 10 m wide and 6.25 m in draught, with these standard proportions, and 10 m deep. Above the design waterline it has vertical sides, which let it float deeper and be heeled in later chapters. This extension is not part of the published benchmark, so results that depend on it are not comparable with published Wigley data.
With measured forward from the AP and up from the baseline, the half-breadth of the Wigley hull, the distance of its surface from the centreplane, is
for and , with vertical sides, , from the design waterline up to the deck. The coordinate runs from −1 at the AP to +1 at the FP, and from 1 at the keel to 0 at the DWL. Every waterline is a parabola in , and every cross-section a parabola in .
The Series 60 hull is a realistic merchant-ship form with a long record of tests. After the Second World War the American Towing Tank Conference and the Society of Naval Architects and Marine Engineers set out to provide a family of parent forms for single-screw merchant ships, from which later research and design could start. The models were tested at the David Taylor Model Basin of the United States Navy between 1948 and 1960, and Todd20 brought the results together. The series has five parent forms, with block coefficients, a measure of fullness, from 0.60 to 0.80. The parent used here is the finest, with a block coefficient of 0.60. It is used at the size to which Todd refers all his results: 400 ft (121.92 m) between perpendiculars, a breadth of 16.256 m and a design draught of 6.502 m, which give = 7.5 and = 2.5. (All five parents have = 2.5, while falls from 7.5 to 6.5 as they become fuller.) The hull is published as a table of offsets, the half-breadths of the hull at a grid of positions, and drawings of the profiles of the bow and the stern. A smooth surface built through them is the Series 60 hull used here, and the Notes on the data compare it with Todd’s particulars. Its deck is flat, with neither sheer nor camber. Its stem meets the design waterline at the FP. Its cruiser stern, a stern with a convex profile, carries the waterline 2.06 m aft of the AP, and its length on the waterline, 123.98 m, therefore exceeds its length between perpendiculars. The Series 60 hull is used in every chapter to check that methods developed on mathematical hulls also work on a realistic ship form. The box is defined by three numbers and the Wigley hull by a formula, but a real hull needs a more general description, the subject of the next section.
1.5 Describing a curved hull
Keep the Series 60 hull in mind through this section. It is a real form, handed down as a table of numbers and two drawings of its ends, from which a surface had to be built before anything could be computed. A machine part can be specified by dimensions (the length of a shaft, the diameter of a bore, a radius here and a chamfer there), but a ship’s hull needs more: its surface is curved in two directions at once, many of its curves cannot be described by a single radius, and its shape must be defined to within millimetres over hundreds of metres. For several centuries the solution was a drawing made in a particular way, together with a full-size version of it laid out on the floor of a mould loft, from which the shapes of the frames were taken8. The drawing is the lines plan. Hull geometry is now defined in a computer, but the lines plan is still the way naval architects describe and read a hull form.
1.5.1 The lines plan
A lines plan is made by cutting the hull with three families of parallel planes, each perpendicular to one of the ship’s axes, and drawing the curve along which each plane meets the surface (Fig. 1.11):
- planes across the ship, at constant distance along it, cut sections, also called stations;
- horizontal planes, at constant height, cut waterlines;
- vertical planes parallel to the centreplane, at constant distance from it, cut buttocks.
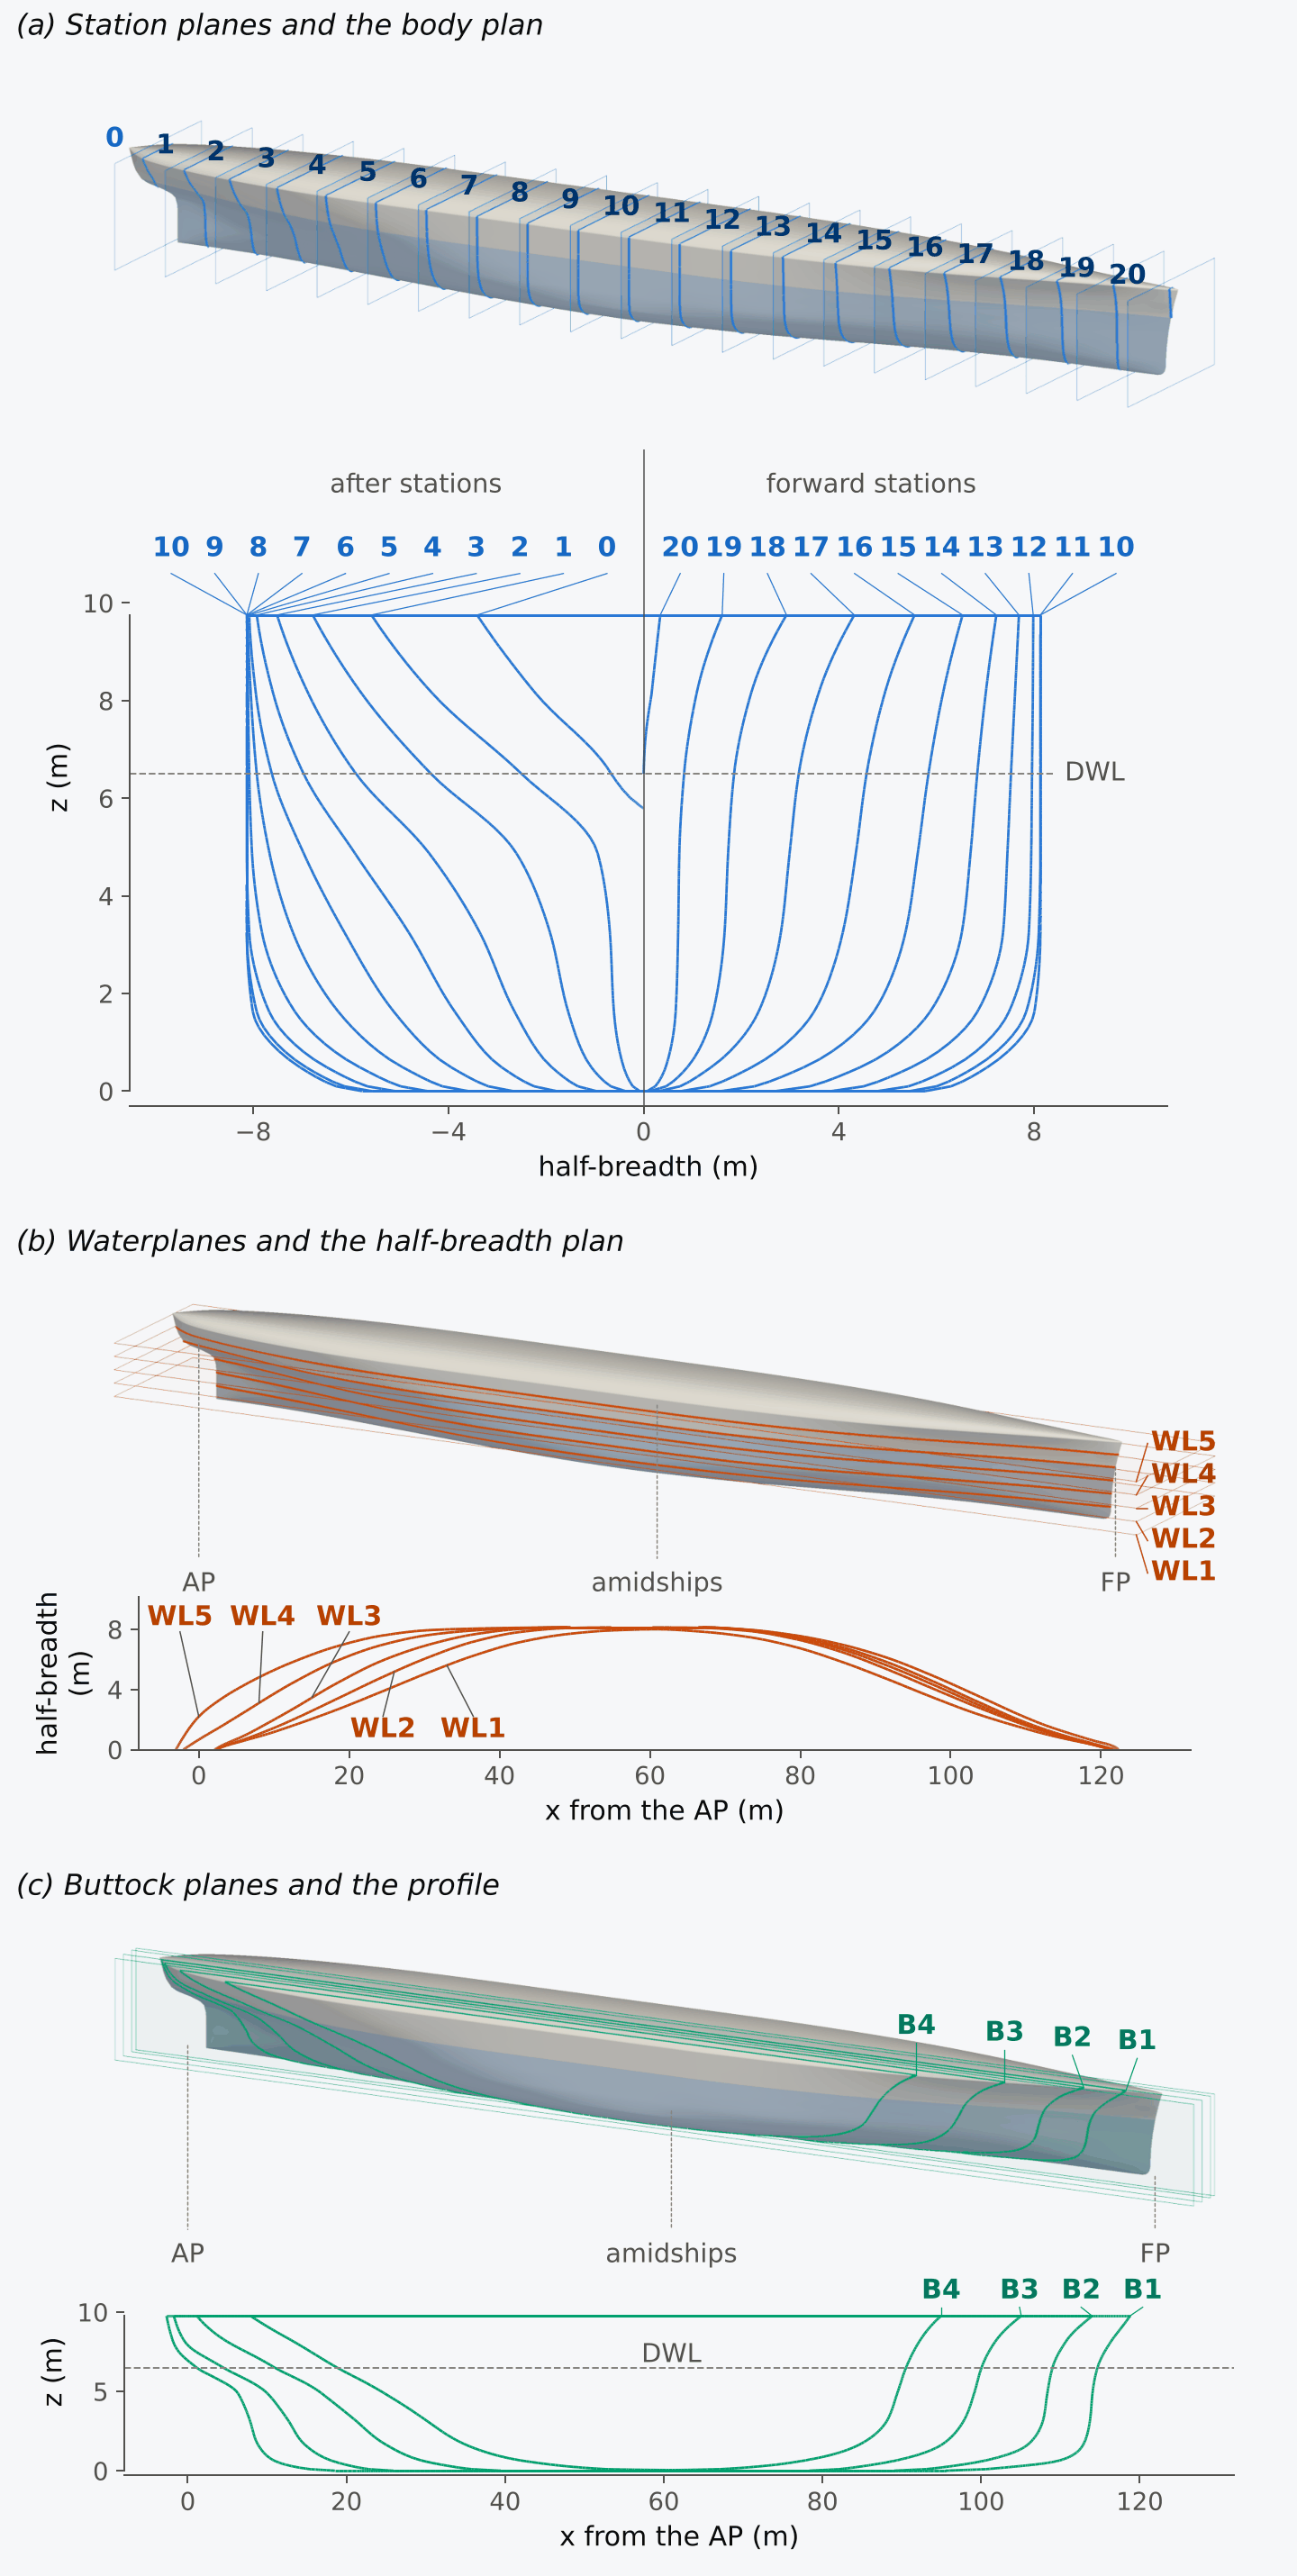
Figure 1.11 Cutting planes on the Series 60 hull and the views they form: (a) stations; (b) waterlines, at 0.25 to 1.25 times the design draught; (c) buttocks, 1, 2, 4 and 6 m from the centreplane. In (b) and (c) breadths and heights are drawn at twice the scale of lengths.
Each family is drawn in the view in which its curves appear in their true shape. The sections, seen end on, form the body plan; the waterlines, seen from above, form the half-breadth plan; and the buttocks, seen from the side, form the profile or sheer plan. Because the hull is symmetric about its centreplane, only half of each waterline and section is drawn. By long convention the body plan shows the sections of the after half of the ship on the left of the centreline and those of the forward half on the right, and both halves share one drawing12,21. The stations are numbered along the ship, but sources differ on the end from which they count. Hamlin gives numbering from the bow, with the FP as station 0, as the customary practice, and numbering forward from station 0 at the AP as frequent in Europe and Japan8; Tupper numbers the sections of merchant ships from aft and those of warships from forward12. The ITTC Dictionary states only that the length between perpendiculars is generally divided into 10 or 20 equal intervals9. In this chapter and the chapters that follow, as in Biran and López-Pulido7, the stations are numbered continuously from 0 at the AP to 10 or 20 at the FP, and the station number grows with . In the body plan of Fig. 1.11(a) the after stations, 0 to 10, stand on the left of the centreline and the forward stations, 10 to 20, on the right, with the midship section, station 10, drawn on both sides.
The three views are orthographic projections, as are most engineering drawings, and each shows two of the three coordinates of a point8,21: the profile shows and , the half-breadth plan and , and the body plan and . Every line of a family joins points at which one coordinate is constant, as a contour line on a map joins points of equal height7: stations are curves of constant , waterlines of constant and buttocks of constant . A curve appears in its true shape in the view that shows its two varying coordinates, and as a straight line in each of the others. A station, curved in the body plan, appears as a vertical line in the profile and in the half-breadth plan. A waterline, curved in the half-breadth plan, appears as a horizontal line in the profile and in the body plan. A buttock, curved in the profile, appears as a straight line parallel to the centreline in the half-breadth plan and as a vertical line in the body plan. Figure 1.12 shows the lines plan of the Wigley hull, with the profile at the top and the half-breadth plan below it. The body plan is drawn below the half-breadth plan and enlarged; on a full lines drawing it is placed above the profile or beside it, on a common baseline, as the sheet allows, or is drawn over the profile amidships8.
A fourth family of lines is also used, the diagonals. A diagonal plane is perpendicular to the station planes but inclined to the baseplane and the centreplane, at an angle chosen to cut the sections roughly at right angles8,21. A diagonal through the turn of the bilge, the curved part of the section between the bottom and the side, is a bilge diagonal; it shows the shape of the hull there better than the waterlines and buttocks, which meet the bilge at shallow angles. In the body plan a diagonal is a straight line, drawn on both sides of the centreline. Its true shape, the expansion of the diagonal, is drawn below the half-breadth plan by plotting at each station the distance along the diagonal from the centreline to the section8. Figure 1.12 includes a bilge diagonal of the Wigley hull, from the point D₁ on the centreline at the DWL to the point D₂ at the half-breadth on the baseline.
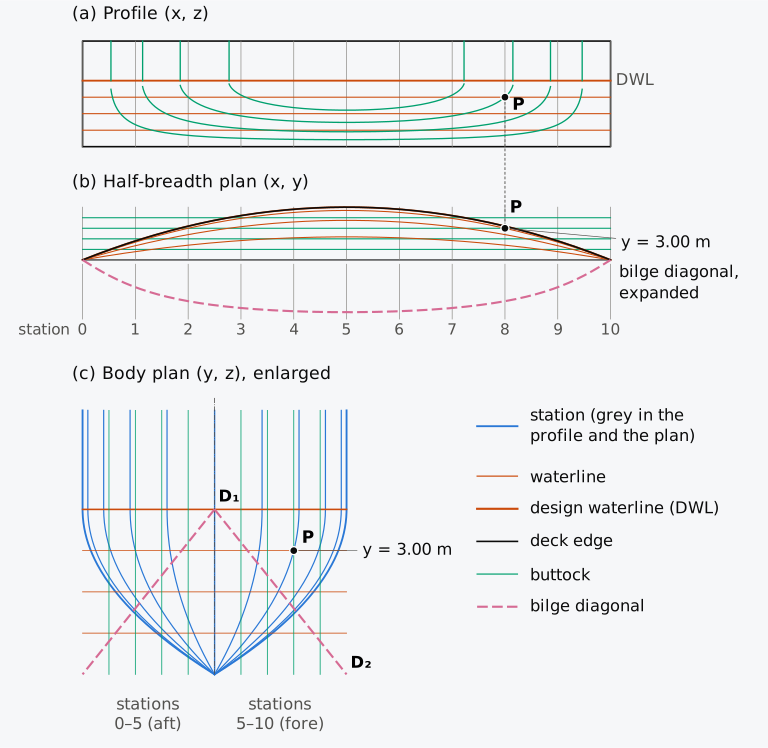
Figure 1.12 Lines plan of the Wigley hull. The point P appears in all three views; the bilge diagonal D₁D₂ is expanded below the half-breadth plan. In (a) and (b) breadths and heights are drawn at twice the scale of lengths.
Stations are usually equally spaced along the length between the perpendiculars, which is customarily divided into 10, 20 or 40 intervals8, and station of intervals lies at . The number of intervals is a convention, and half or quarter stations are often added near the ends, where the hull curves most8. Where the hull extends beyond a perpendicular, as at a cruiser stern or a bulbous bow, further stations are drawn outside it and named by letters, by their distance from the perpendicular, or by numbers that continue the series beyond it8. A source that numbers intervals from the FP has its station at station here.
Stations should not be confused with frames. The frames are transverse members of the structure, spaced to suit the strength and the arrangement of the ship, and their positions do not depend on those of the stations8,21. Stations are equally spaced because that suits the rules of integration of Chapter 2, and they are chosen early, before the structure is designed21. Frames are numbered with integers, from the AP forwards or from the FP aft, and arrangement drawings show their positions; a position on board is often given by frame number. A drawing must therefore state the frame spacing, the direction of numbering, and whether the frame line is the forward or the after edge of the frame8. With frame 0 at the AP and a constant frame spacing , frame lies at ; with frame 0 at the FP it lies at .
Figure 1.13 is the lines drawing of a real ship, made largely from measurements of its hull. The Balclutha, a three-masted sailing ship built in 1886, was measured in 1988 by the Historic American Engineering Record, from inside the hull while it was afloat, on 17 sections taken at frames, the sheet’s “field stations”22. The profiles of the keel and stem were taken from its original midship section and a rigging plan, and the waterlines and buttocks were drawn as smooth curves between the measured sections22. On the sheet all the views are drawn to one scale, 3/32 in to 1 ft (1:128), with the body plan apart at the top; Fig. 1.12, in contrast, doubles the breadths and heights and enlarges the body plan. Waterlines are named by their height above the baseline in feet, and buttocks by their distance from the centreline. The stations of the drawing are a separate set from the measured sections22; the section taken at frame 8, for example, lies between stations 2 and 3. They run from 0 at the AP to 20 at the FP, with the after sections on the left of the body plan, but they are not equally spaced. Their spacing, 24 ft 6 in, is a tenth of the length of its waterline in 1988, rounded up; towards the ends it is halved and then quartered, and every station keeps a whole number22.
The drawing also shows features that the Wigley hull lacks: a deck that rises towards both ends, a keel below the baseline, a stem that curves forward above the water and a stern that overhangs the rudder. Some of its lines are not cuts by planes but edges of the hull surface, among them the outline of the stem, keel and stern and the deck at side23. The outline lies in the centreplane and appears in the sheer plan only; the deck at side is a curve in space and appears in all three views8; on this sheet it is the dashed line labelled “Sheer”22.
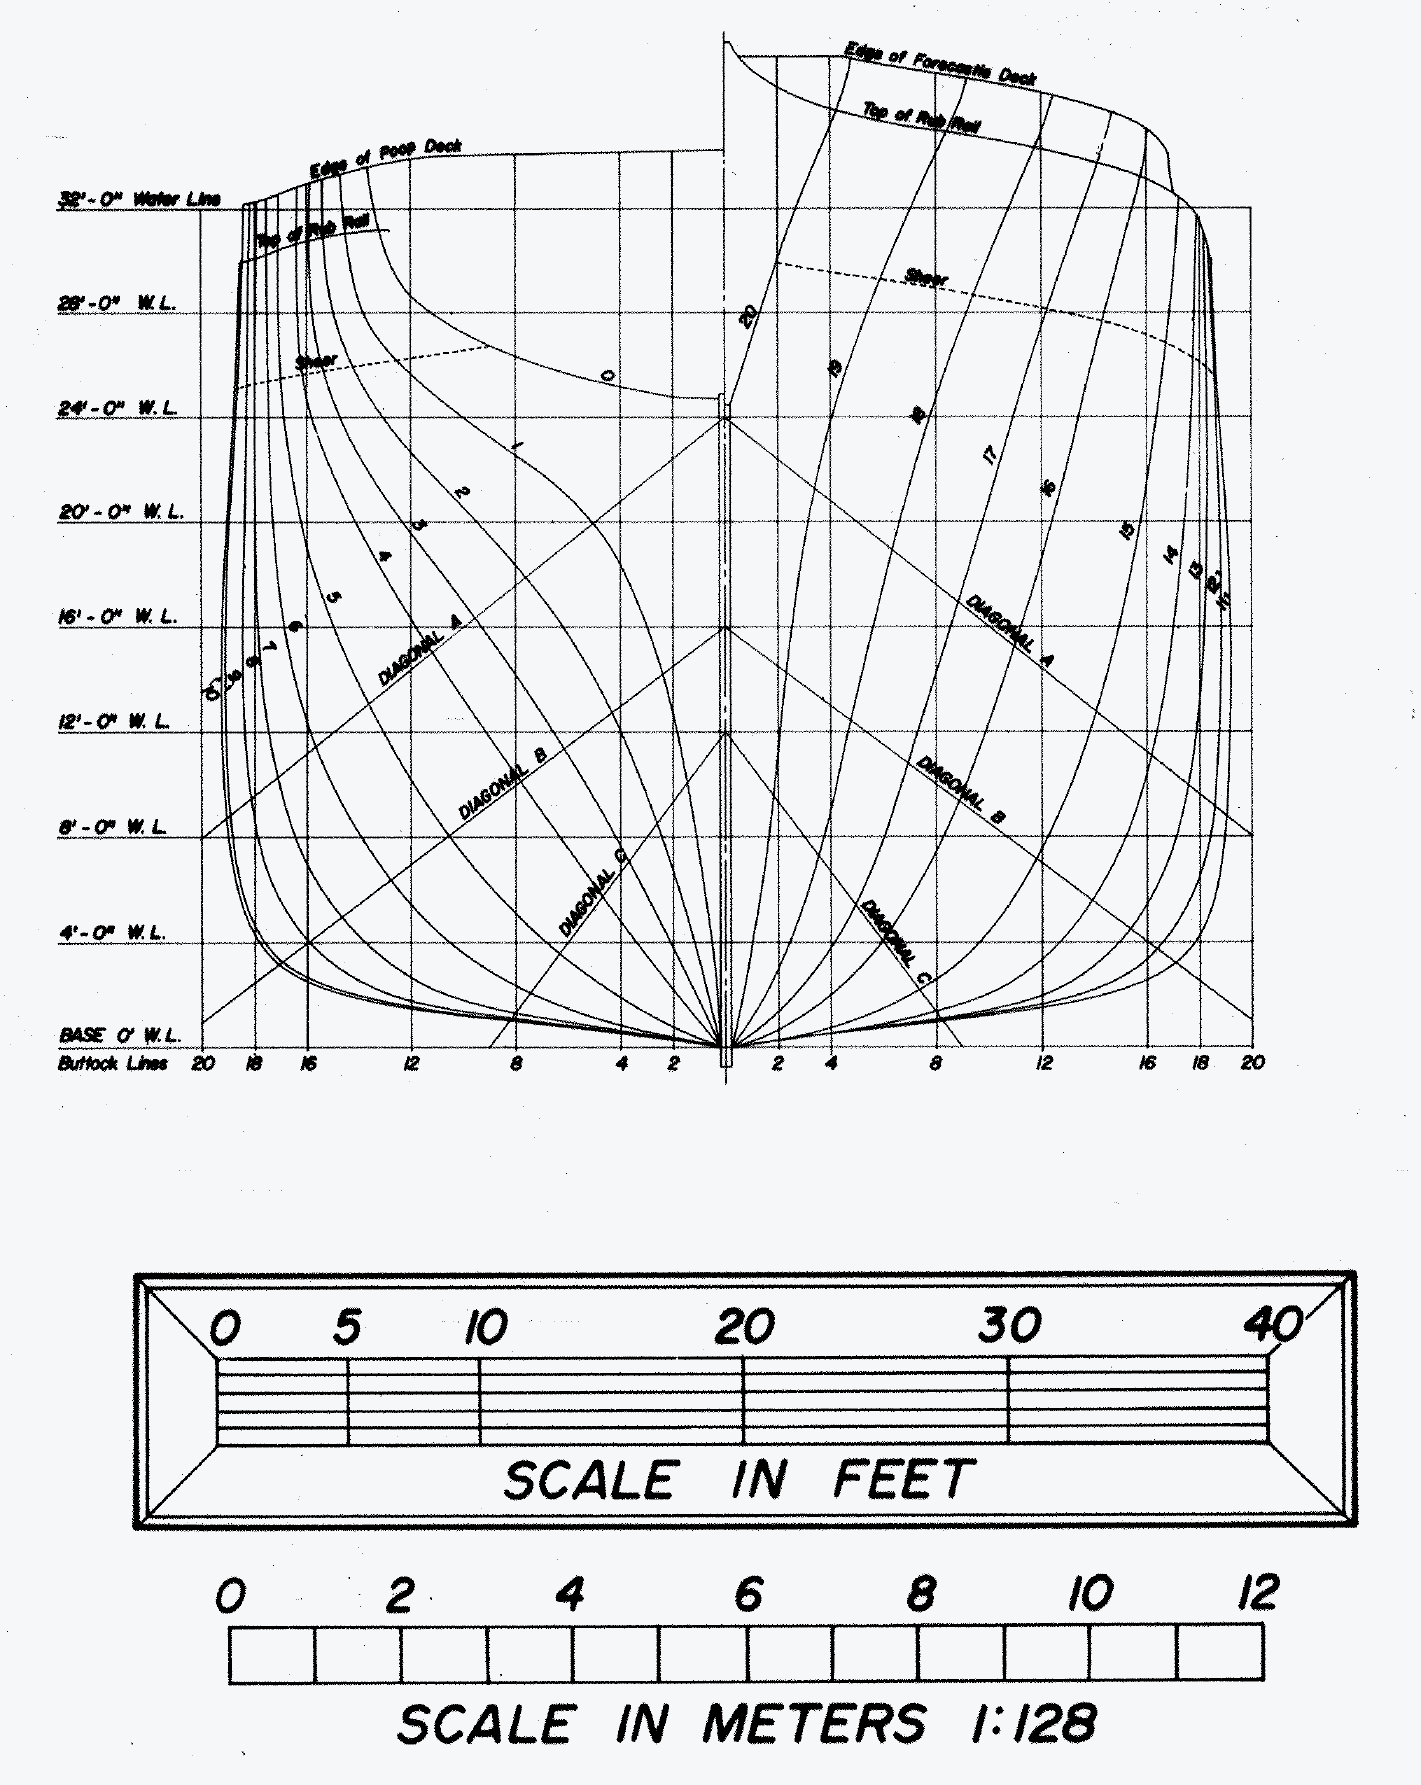
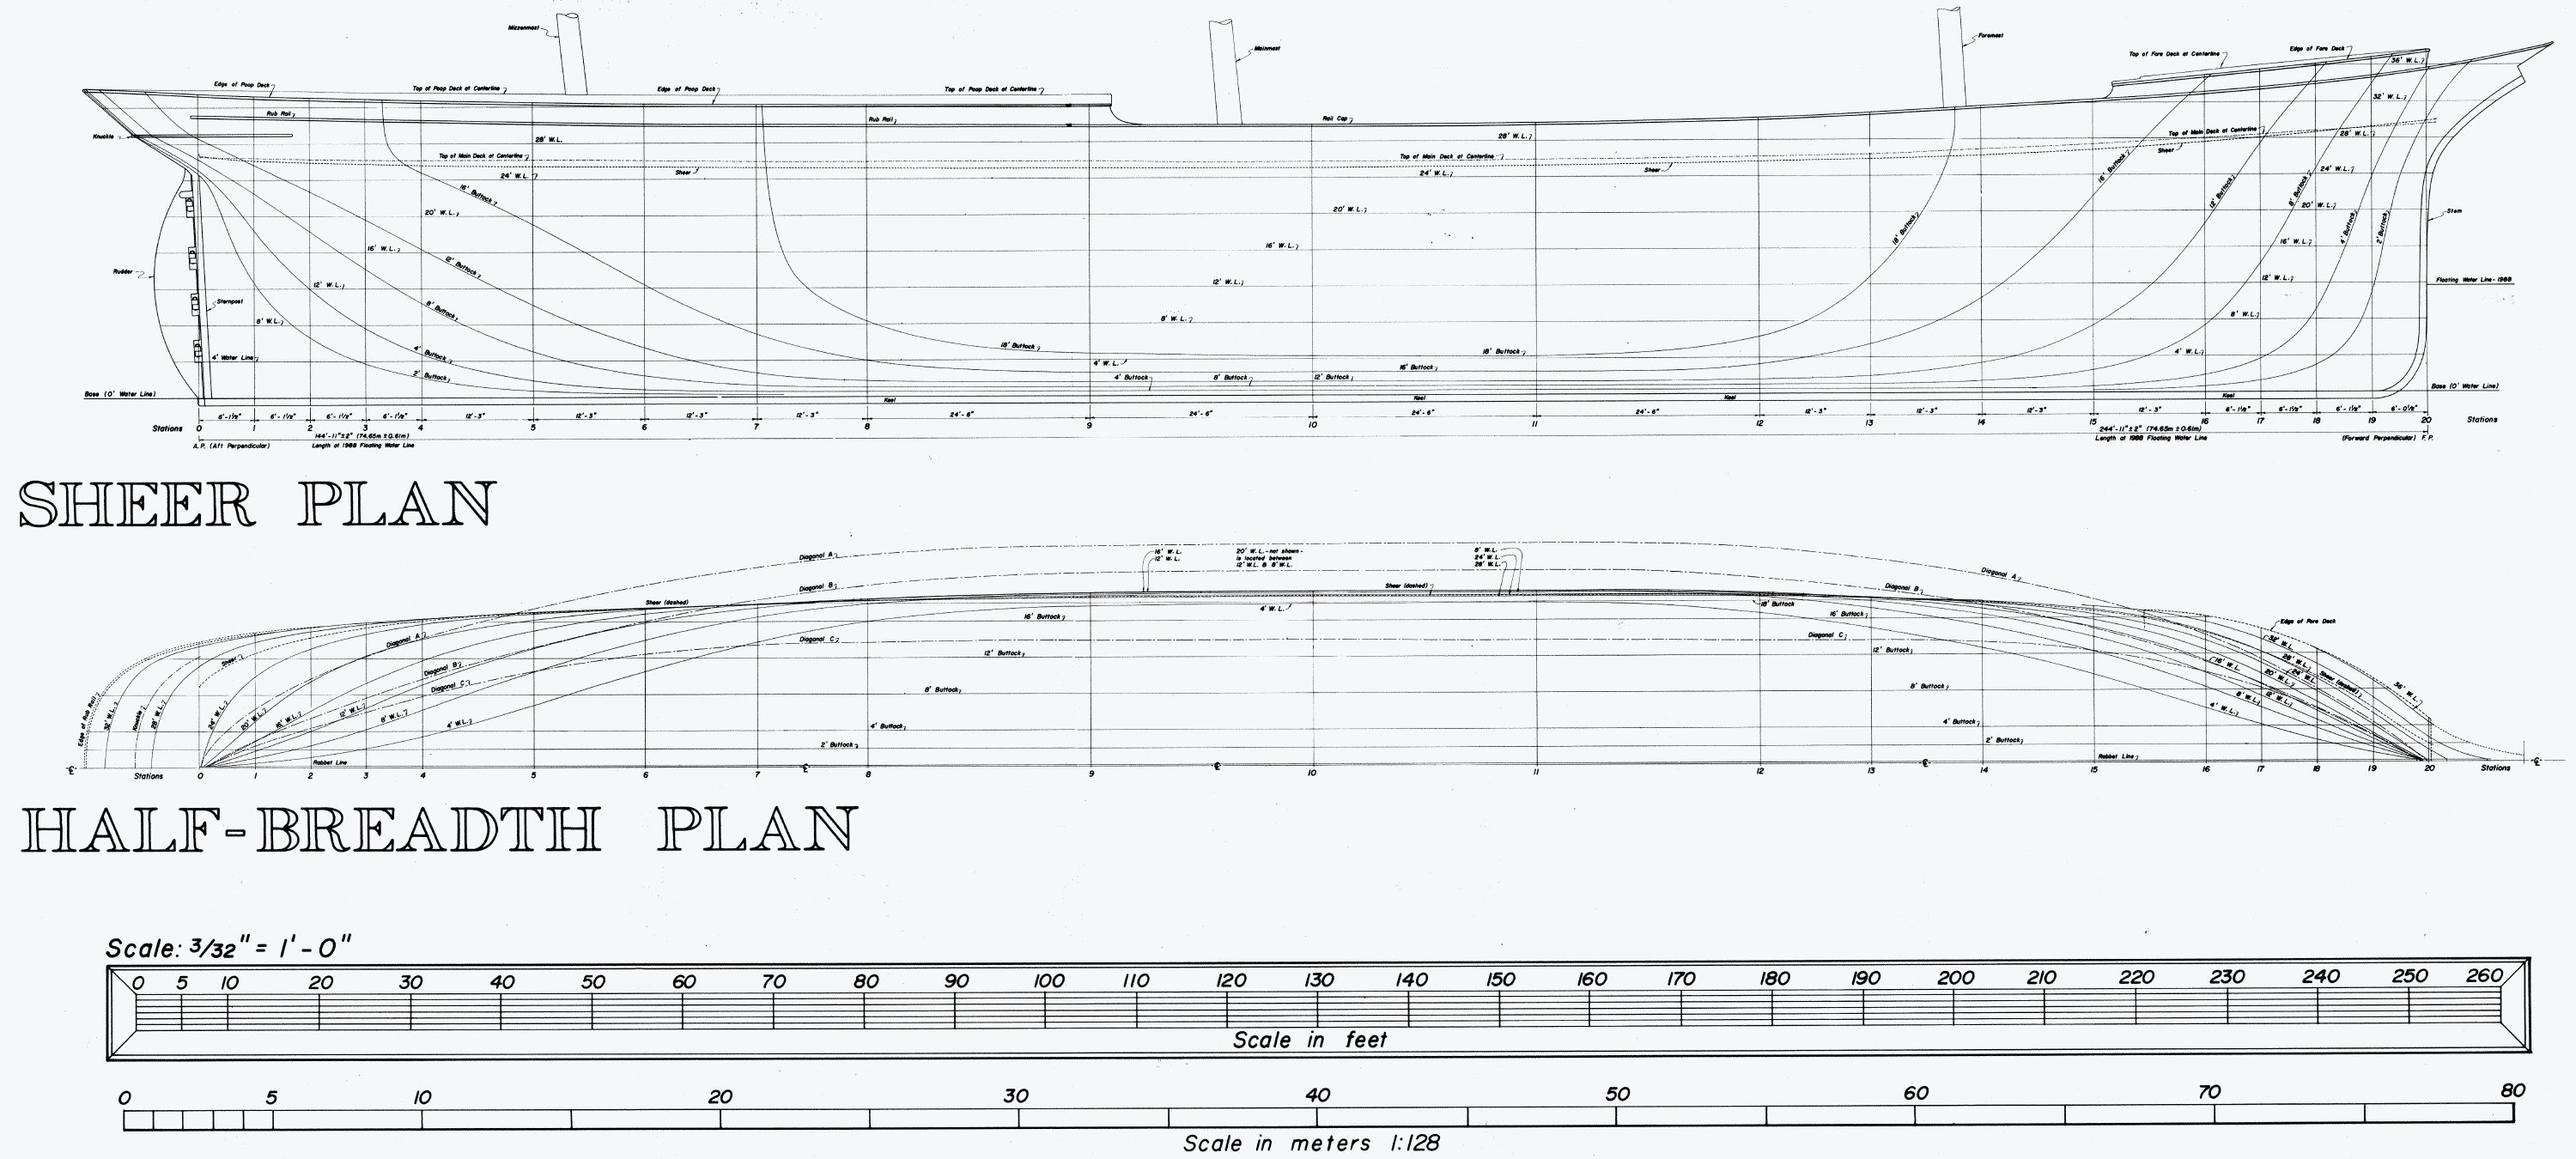
Figure 1.13 Lines of the sailing ship Balclutha (1886), measured on board in 1988: (a) body plan, enlarged; (b) sheer and half-breadth plans. Each part is read with its own scales; the notes of the sheet are left out. Full sheet: https://www.loc.gov/pictures/resource/hhh.ca1493.sheet.00003a/. Historic American Engineering Record, National Park Service, HAER CA-54, sheet 3 of 69, delineated in 1990 by Robbyn L. Jackson22. Public domain.
1.5.2 Consistency and fairness
The three views of one surface must agree. At the point P in Fig. 1.12, where station 8 meets the waterline at three-quarters of the design draught, the half-breadth can be read in the body plan from the curve of station 8, giving 3.00 m, and again in the half-breadth plan from the curve of that waterline at station 8, also giving 3.00 m. In the profile, P lies where the vertical line of station 8 crosses the horizontal line of the waterline. Two views together contain all three coordinates, so they fix the point, and the third must agree21. This property is consistency; a lines plan whose views disagree does not define a surface.
Try it. The point Q lies on station 3 at half the design draught. Find Q in each view of Fig. 1.12. In which view is it the crossing of two straight lines? Between which two buttocks does it lie, in the half-breadth plan and in the profile, and what does that tell you about its half-breadth? The buttocks are 1, 2, 3 and 4 m from the centreplane.
A consistent lines plan must also be fair: smooth, with no unintended bumps, flats or reversals of curvature. Fairness cannot be reduced to a single mathematical test. Continuous slope and curvature are necessary but do not guarantee a fair line, and some breaks are intended8, such as a chine or a knuckle, a corner in the hull surface that runs along a considerable length of the ship9. The midship section of many full ships fails the test of continuous curvature without being designed as a break. Its circular bilge meets the flat bottom and the vertical side with continuous slope, but the curvature jumps at each point of tangency. Such a section need not be a disadvantage, and a transition curve at each of these points would remove the jump8. Fairing was skilled work, made harder by the scale of the drawing. On a lines plan of a 150 m ship drawn to fit a sheet one metre long, the width of a pencil line corresponds to a few centimetres at full size, so irregularities of that size cannot be seen. For this reason the lines were redrawn full size on the mould loft floor and faired there, until optical and then numerical methods replaced lofting in the second half of the twentieth century7,8.
1.5.3 The table of offsets
An offset is a distance from a reference plane to the surface of the hull, such as a half-breadth, measured from the centreplane, or a height, measured from the horizontal plane through the baseline. Calculations need numbers rather than drawings, and traditionally the numbers that define a hull are its table of offsets, with one row for each station21. A complete table gives the half-breadths of the moulded surface (Sec. 1.2.5) on each waterline and at the edge of each deck, and the heights above the baseline of each buttock, of the deck at side and of the keel; for a ship with a flat keel it also gives the half-siding, the half-width of the flat8. The table is in effect two tables side by side, a table of half-breadths and a table of heights23. A half-breadth is the -coordinate of a point of the hull whose is set by its station and whose by its waterline, and a height is the -coordinate of a point whose is set by its station and whose by its buttock. A curve in space, such as the deck at side, needs both coordinates and appears in both23.
Table 1.2 is such a table for the Wigley hull; its entries, the points where the lines of Fig. 1.12 cross, are computed from the formula of the hull. Full-scale offsets in metres are given to the millimetre8, and every integral in Chapters 2 to 8 can be evaluated from such a table. The offsets sent to the mould loft were marked preliminary; after the lines had been faired there at full size, a finished table, with offsets at every frame, was lifted from the loft floor and returned to the drawing office8. Today the table is generated from the faired surface model21. Tables for model series are usually non-dimensional, and one table serves every size of ship. Todd20 gives each Series 60 offset as a fraction of the largest half-breadth of its waterline, gives that largest half-breadth as a fraction of , and numbers the stations from the FP.
Table 1.2 Table of offsets of the Wigley hull (m): half-breadths on the waterlines at height above the baseline, and the heights above the baseline at which the buttocks at distance from the centreplane cross each station. Stations 6 to 10 mirror stations 4 to 0. A dash marks a buttock that does not meet the section. The deck is flat at = 10 m, and above the DWL the sides are vertical, so the half-breadth of the deck at each station is that of the DWL; the keel is a line, without a flat.
| Station | = 0 | = 1.5625 | = 3.125 | = 4.6875 | = 6.25 (DWL) | = 1 | = 2 | = 3 | = 4 | |
|---|---|---|---|---|---|---|---|---|---|---|
| 0 | 0 | 0 | 0 | 0 | 0 | 0 | – | – | – | – |
| 1 | 10 | 0 | 0.7875 | 1.3500 | 1.6875 | 1.8000 | 2.083 | – | – | – |
| 2 | 20 | 0 | 1.4000 | 2.4000 | 3.0000 | 3.2000 | 1.068 | 2.423 | 4.688 | – |
| 3 | 30 | 0 | 1.8375 | 3.1500 | 3.9375 | 4.2000 | 0.795 | 1.727 | 2.909 | 4.886 |
| 4 | 40 | 0 | 2.1000 | 3.6000 | 4.5000 | 4.8000 | 0.689 | 1.476 | 2.423 | 3.698 |
| 5 | 50 | 0 | 2.1875 | 3.7500 | 4.6875 | 5.0000 | 0.660 | 1.409 | 2.297 | 3.455 |
Each entry of Table 1.2 is a point of the hull, and some points appear twice. On station 2 the half-breadth on the waterline at = 4.6875 m is 3.0000 m, and the 3 m buttock crosses that station at 4.688 m. Both entries give the point = (20, 3, 4.6875) m, once as a half-breadth and once as a height, and they agree to the precision of the table. Points given twice in this way allow a table to be checked before any line is drawn.
A lines plan is drawn from such a table in the order in which its lines depend on one another. The grid is drawn first in each view: the station lines, waterlines and buttock lines, the baseline and the centreline. The half-breadths are plotted at their heights in the body plan, together with the points where each section crosses the buttock lines, and each section is drawn through its points; the half-breadths of each waterline are then transferred to the half-breadth plan and the waterlines drawn through them. The deck at side and the outline of the stem, keel and stern are plotted in each view in which they appear, from the half-breadths and heights that the table gives for them. Each buttock is constructed in the profile from two sets of points: its height at each station, read from the body plan, and the position at which it crosses each waterline, read from the half-breadth plan. Both sets must lie on one fair curve. Where they do not, some offsets are wrong or some lines are unfair, and lines in the other views are adjusted and redrawn until all three views agree8,12. Each round of this trial typically leaves 20 to 30 % of the discrepancies of the round before, and three to five rounds usually bring them down to about the accuracy of the drawing23. In Fig. 1.12, for example, the 3 m buttock crosses station 3 at 2.909 m, and by the formula of the hull it crosses the waterline at 3.125 m at = 27.64 m; both points lie on one curve in the profile (Exercise 1.14).
1.5.4 Splines, Bézier curves, B-splines and NURBS
Before computers, a fair line was drawn with a spline: a long, thin, flexible strip of wood or metal held at chosen points by heavy lead weights called ducks (Fig. 1.14(a)). A uniform batten bends into a smooth curve between the ducks, and a common test of fairness was to adjust the ducks until any one of them could be removed without the batten moving8. Mechanically, the batten is a beam supported at the ducks. If a batten of flexural rigidity is bent to the curve by a bending moment , the theory of beams gives its curvature as
where the approximation holds while the slope is small8. Between two ducks the batten carries no load, so , and with it , varies linearly along it, and the curve between the ducks is a cubic. At the free ends the moment, and so , is zero. The mathematical cubic spline, a chain of cubic polynomials joined with continuous slope and curvature and passing through every given point, is this small-slope beam written as equations; in 1946 Schoenberg named such curves “spline functions”7,21.
The small-slope form also gives a numerical test of fairness. If offsets are given at equal spacing , the second difference
approximates at point . Plotted along the curve, it magnifies irregularities that are hard to see in the offsets, and a curve can be faired by smoothing the plot of its second differences and adjusting the offsets to match8. The small-slope form fails where the slope is large, as on most sections and on buttocks near the ends; there the curve is written in parametric form, with the length along it as the parameter8.
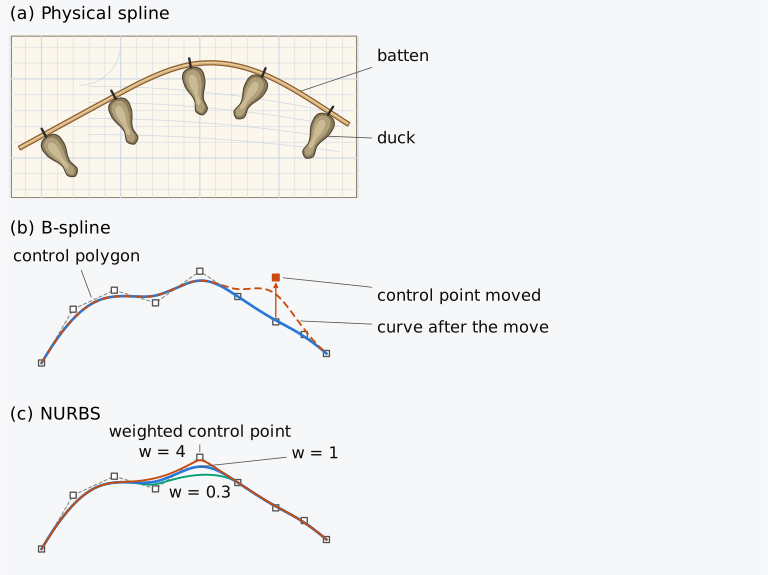
Figure 1.14 From battens to NURBS: (a) a physical spline, a wooden batten held by lead ducks, seen from above; (b) a B-spline and its control polygon; (c) a NURBS curve with one weight varied.
In design, curves that pass through given points have the disadvantage that moving one point can change the whole curve. Modern hull design therefore uses curves that are steered by points they do not, in general, pass through. A curve can be written in three ways. An explicit curve gives one coordinate as a function of another, ; an implicit curve is the set of points satisfying an equation, such as for a circle; and a parametric curve gives every coordinate as a function of one parameter , as in , . Ship lines need the parametric form23. The Series 60 midship section cannot be written as , because its flat bottom has many half-breadths at one height, nor as , because its vertical side has many heights at one half-breadth. A waterline that rounds into the centreline at its end has an infinite slope there, which no polynomial can have. A parametric curve meets none of these difficulties, and hull geometry uses parametric curves almost exclusively.
The simplest curves steered by control points are the Bézier curves, introduced in the French car industry by de Casteljau and Bézier7. A cubic Bézier curve has four control points to :
Each point of the curve is a weighted mean of the control points, with weights, the Bernstein polynomials, that add up to 1. The curve passes through the first and the last control point only, and there it is tangent to the first and the last side of the control polygon. A curve of degree has control points, weighted by the terms of the expansion of . Cubics are the usual choice, because a cubic is the lowest degree that can have a point of inflection, which some ship lines need7. The disadvantage of a Bézier curve is that moving any one control point changes the whole curve.
A B-spline removes that disadvantage. It is a parametric curve built from polynomial pieces of degree , joined at parameter values called knots, and controlled by a sequence of control points. The list of knots is the knot vector; if the knots are equally spaced the B-spline is uniform, and otherwise non-uniform7. In general the curve does not pass through its control points but is drawn towards them, rather like a batten tied to its ducks by springs instead of being pinned to them. The usual exception is at the two ends: a clamped B-spline starts at its first control point and ends at its last. Control is local: a control point of a curve of degree acts over at most intervals between knots, four for a cubic, so moving it changes only the nearby part of the curve23 (Fig. 1.14(b)). The curve also stays within the convex hull of its control points, so it cannot stray far from the polygon that steers it. If consecutive control points lie on a straight line, part of the curve lies exactly on that line23, so a B-spline can have truly straight parts, such as the flat bottom and the vertical side of a midship section. These properties make the B-spline suitable for shaping hulls. A NURBS curve (non-uniform rational B-spline) adds a weight to each control point, which makes the curve a ratio of two weighted sums, that is, rational7. A larger weight pulls the curve closer to its point (Fig. 1.14(c)), and with suitable weights circles and other conic sections are represented exactly, which polynomial splines cannot do. Surfaces are built from nets of such curves in two parameters. A modern hull is defined by NURBS surface patches, from which sections, waterlines and offsets are derived as needed.
1.5.5 Triangulated surfaces
A fourth form is used for computation. A closed surface can be approximated by a mesh of small flat triangles, each defined by its three corners. A mesh is not a design surface, since nobody shapes a hull triangle by triangle, but it is the common exchange format of computation: flow solvers, 3-D printers and visualization tools read it, and every design system can export a mesh. The Series 60 surface, built through Todd’s offsets with shape-preserving piecewise cubics (Notes on the data), was triangulated into a mesh of 61,432 triangles. Figure 1.15 shows part of the surface drawn with fewer, larger triangles, which can be seen one by one.
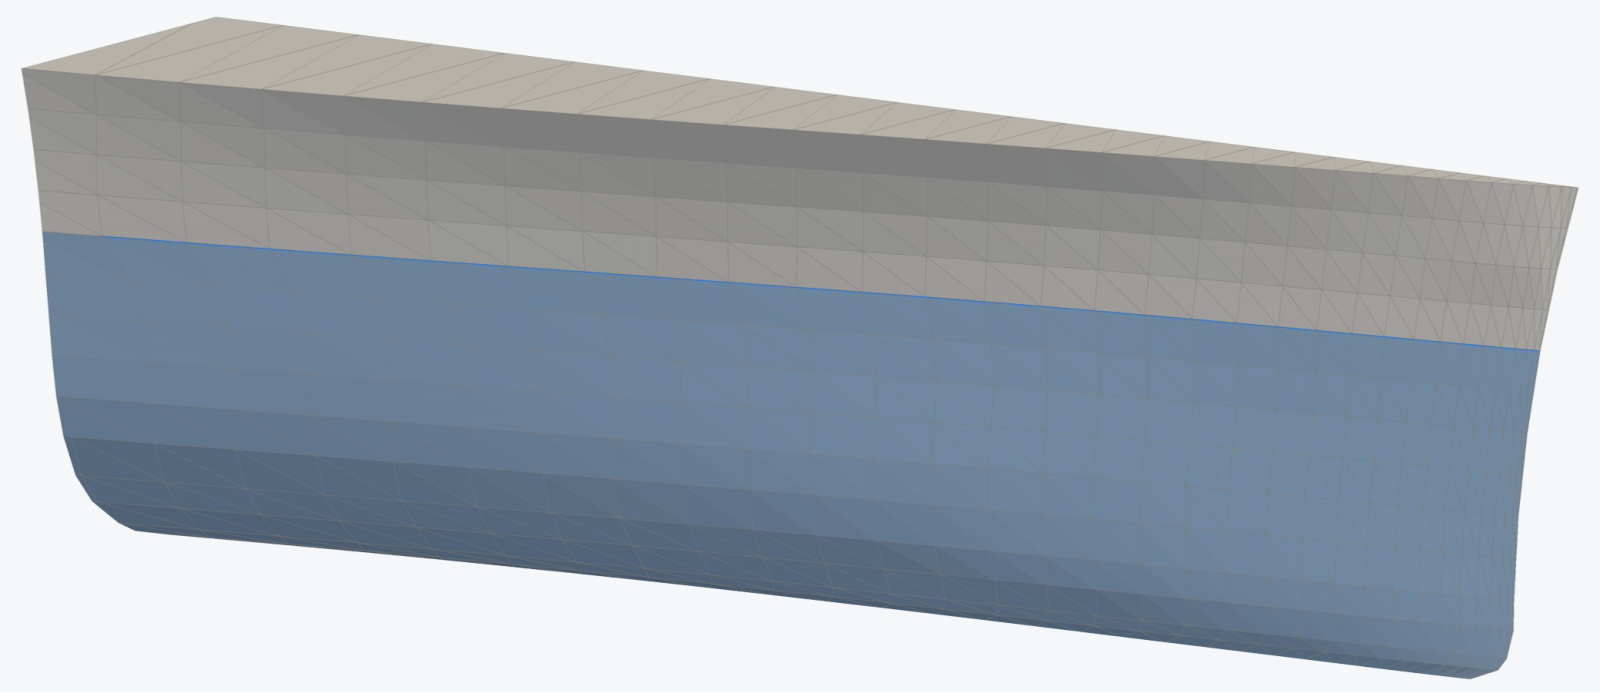
Figure 1.15 The forward quarter of the Series 60 hull as a triangulated surface: 6136 triangles for the whole hull as drawn, 61,432 in the mesh used for the calculations.
A closed mesh also encloses a volume, so the volume and its centroid can be computed directly from the triangles, without cutting sections, by converting the volume integral into an integral over the surface (the divergence theorem). The Series 60 values in this chapter were computed by integrating the surface over a fine grid of sections and checked against the mesh in this way; the two displacement volumes differ by 0.04 %.
1.5.6 The lines of the Series 60 hull
A mesh (Sec. 1.5.5) contains everything a lines plan contains, because any plane can be passed through it. Figure 1.16 is the lines plan of the Series 60 hull, with every line obtained by intersecting the mesh with planes.
Each view of a lines plan shows some features of the form better than the others. The body plan shows the shape of the sections, including how sharply the bottom turns into the side and whether the side flares above the waterline, and sections that nearly coincide mark a length over which the hull changes little. The half-breadth plan shows how fine the waterlines become towards the ends, and where waterlines coincide the side is vertical between them. It also shows the waterlines ahead of the propeller, where large waterline angles and blunt endings are avoided, because they can make the flow separate from the hull, which adds resistance and causes vibration excited by the propeller8. The profile shows, along the buttocks, how the bottom rises towards the ends. Over a parallel middle body, the length over which the sections are identical, they coincide in the body plan, and the waterlines and buttocks run straight, parallel to the centreline and the baseline.
Read in this way and set beside Fig. 1.12, Fig. 1.16 shows how far a real ship departs from the Wigley hull. Amidships the sections have a flat bottom, vertical sides and a well-rounded bilge, and stations 9 and 11 nearly coincide with the midship section, whose area they match within about 1 %. Even so, this fine hull (block coefficient 0.60) has no two identical sections, so it has no parallel middle body. Forward, the sections become V-shaped towards the stem, the forward edge of the hull, which is almost vertical below the design waterline and raked, or inclined forward, above it. Aft, the lower parts of the sections narrow towards the centreline, and the hull there, the deadwood, ends 2.3 m forward of the AP to leave room for the propeller and rudder, while above the waterline the cruiser stern, whose profile is convex, overhangs the AP. In profile the inner buttocks lie along the flat bottom over the middle of the ship, the outer buttocks cross the bilge, and all of them rise towards the ends, gradually aft and steeply forward.
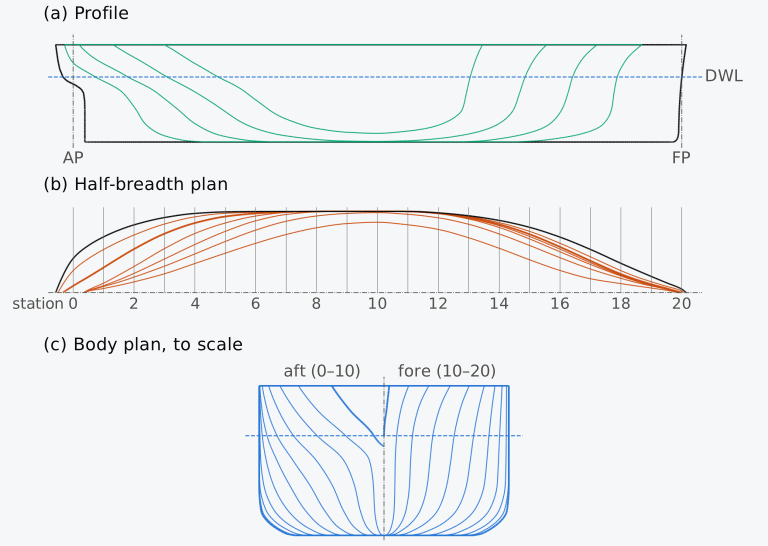
Figure 1.16 Lines plan of the Series 60 hull, cut from its triangulated surface: buttocks 2, 4, 6 and 7.5 m from the centreplane; waterlines at 0.075 to 1.25 times the design draught. In (a) and (b) breadths and heights are drawn at twice the scale of lengths.
Figure 1.17 shows the lines of this hull as Todd published them20. His body plan has the after sections on the left, as in Fig. 1.16, but his stations run from 0 at the FP to 20 at the AP, and his station is station here. He labels the waterlines by their height as a fraction of the design draught, from 0.075 WL to 1.50 WL, and his two buttocks, 0.075 and 0.25, measured on the body plan, lie at those fractions of the draught from the centreplane. Of the profile and the half-breadth plan he draws only the two ends, to about the scale of the body plan. Each end view shows, on one grid, the contour and the buttocks in profile and the waterlines in plan, their half-breadths set up from the baseline; the line labelled TANGENT is where the sections leave the flat bottom. These views give what a table of offsets cannot, the contour of each end and the way each waterline runs into it, between the stations and beyond the perpendiculars. The surface takes the two contours from his Figure 11, where they are dimensioned20. The surface follows his lines closely, as a comparison of Figs. 1.16 and 1.17 shows.
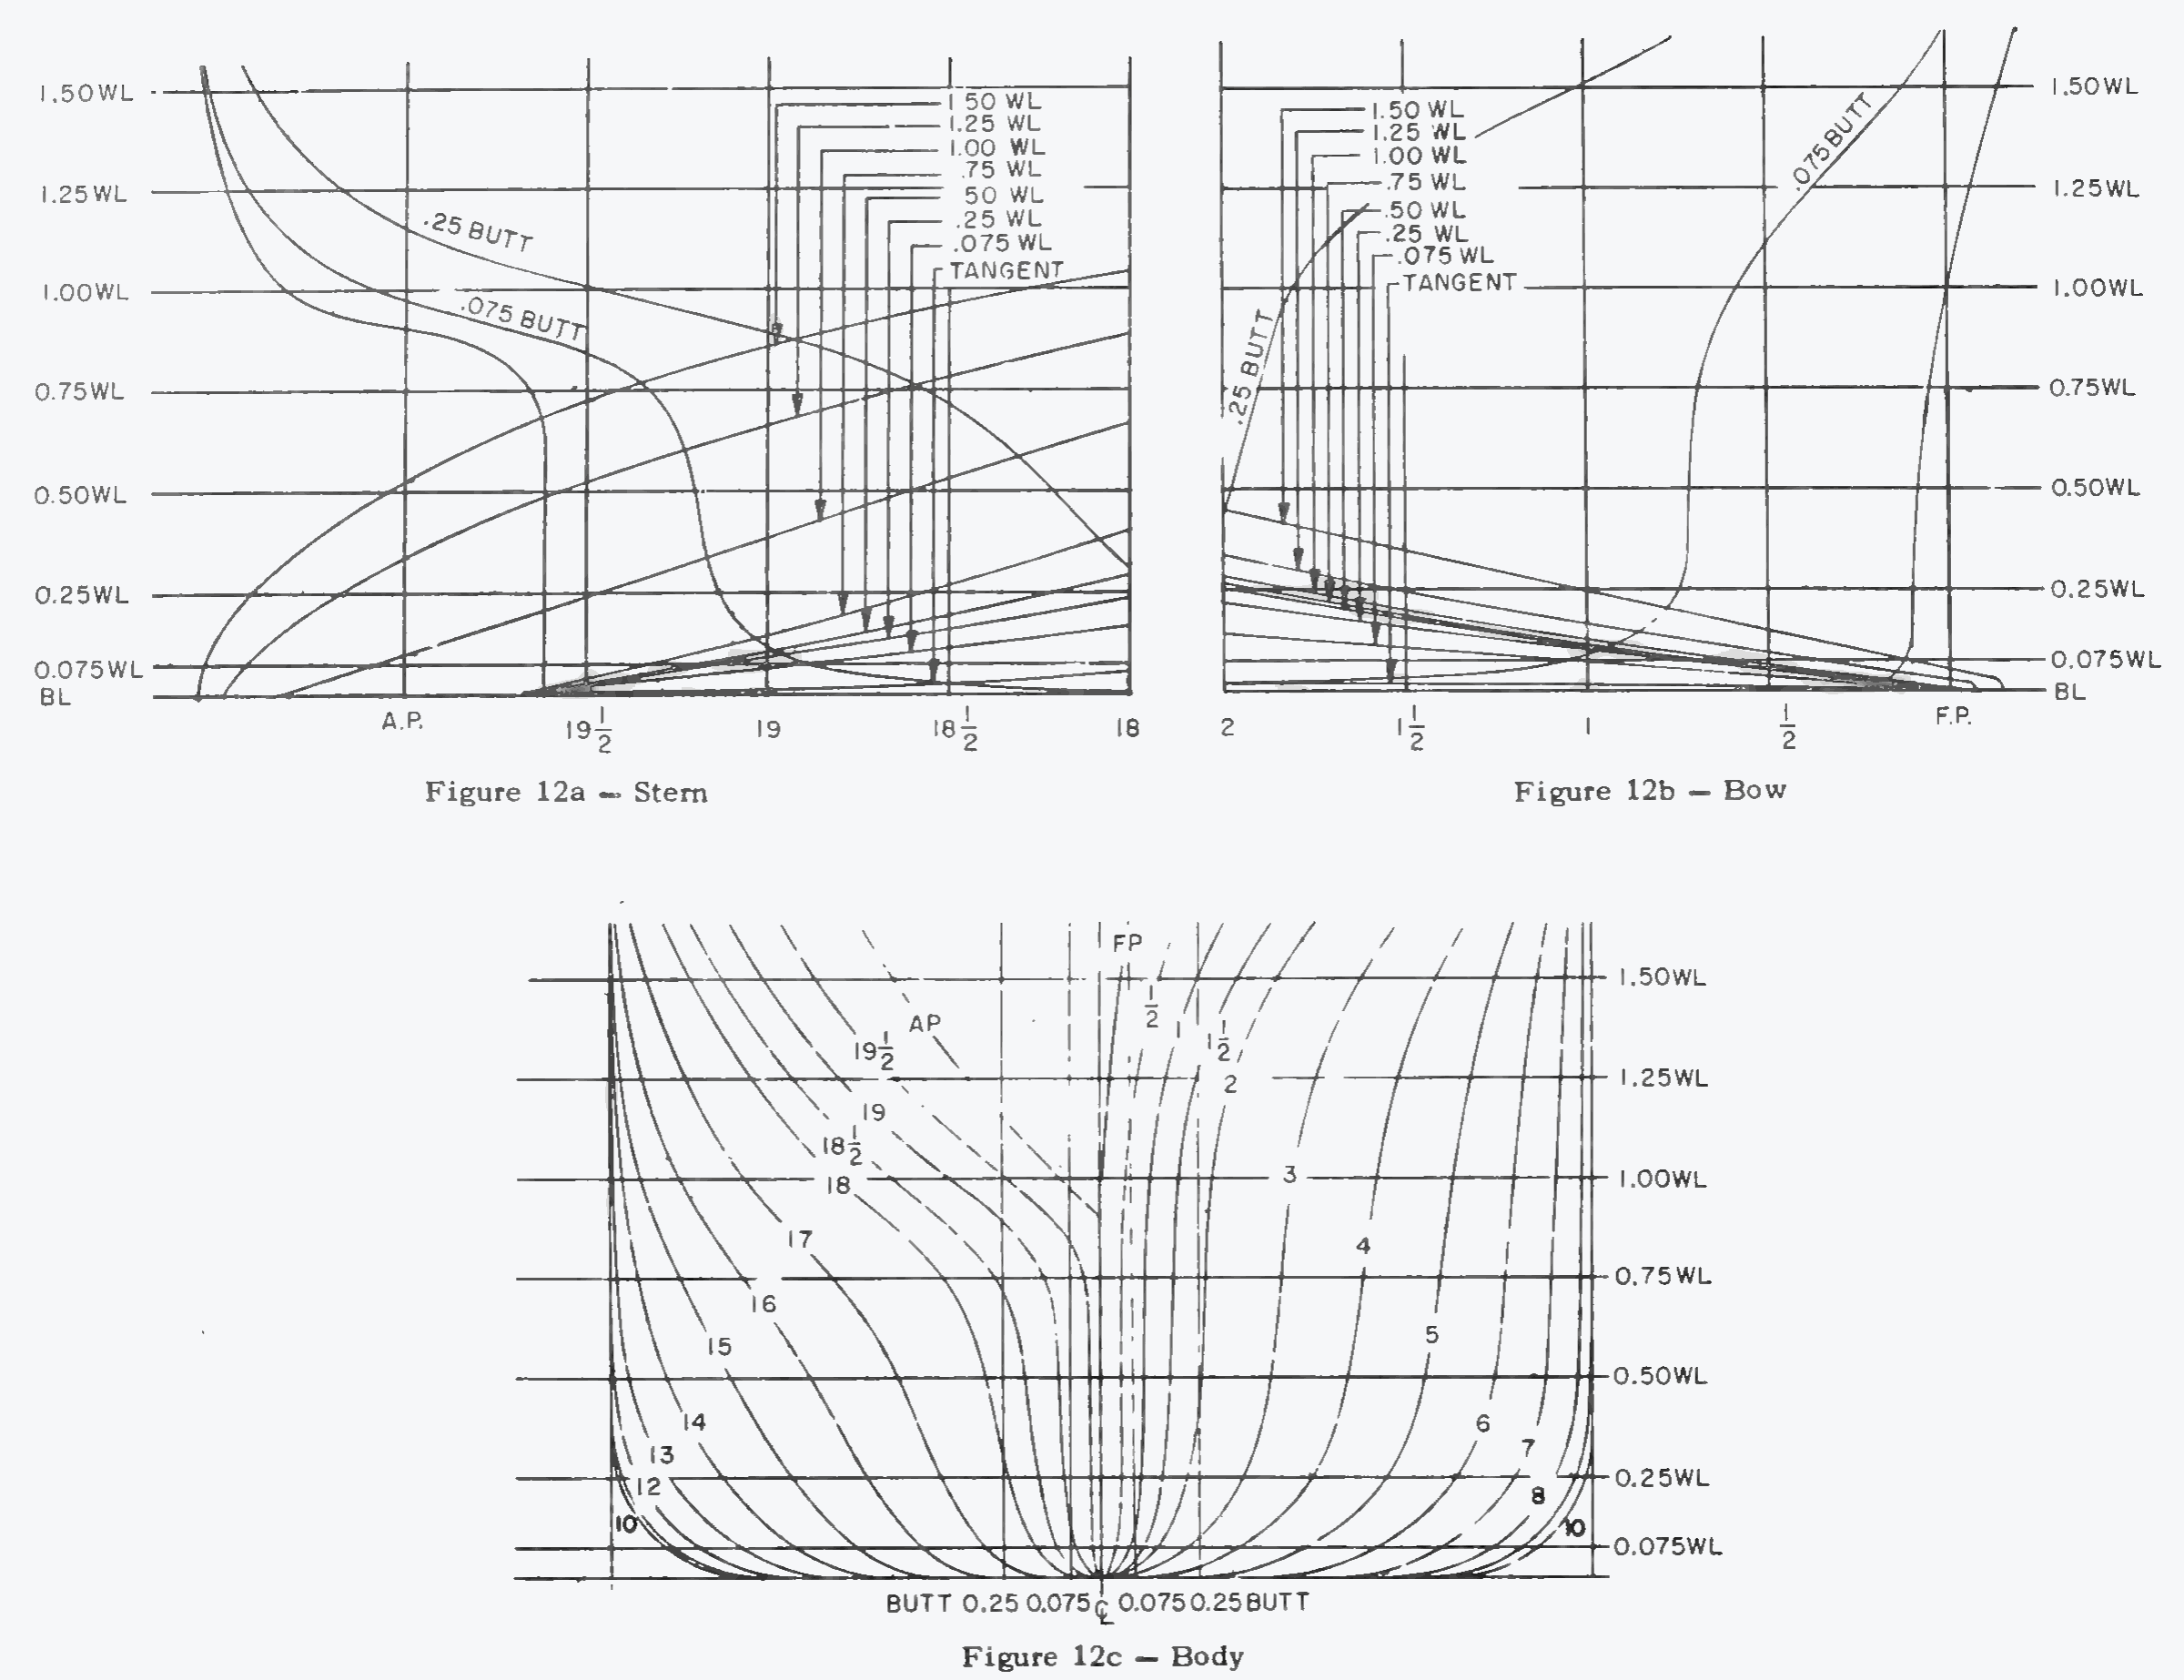
Figure 1.17 Lines of the Series 60 parent hull with block coefficient 0.60 (model 4210W) as published by Todd: (a) stern; (b) bow; (c) body plan, after sections on the left. Todd numbers the stations from 0 at the FP to 20 at the AP. Todd20, scan by the MBLWHOI Library. Public domain.
A lines plan with its table of offsets, a mathematical surface and a mesh all describe the shape of a hull, but not equally completely. A table of offsets fixes the hull only at its tabulated points, and a complete surface needs a rule for fairing between them, which slightly affects the computed coefficients of the Series 60 hull (Notes on the data). A mesh approximates a surface, with an accuracy that depends on the size of its triangles, and only a mathematical surface defines every point exactly.
1.6 Displacement, waterplane and centres
Now that the hull has been measured, placed in a frame of axes and described, the two quantities asked for at the start of the chapter, the displacement and the position of B, can be written down as integrals over it. They are written here and evaluated by the rules of Chapter 2; Exercise 1.10 evaluates them for the Wigley hull with the simplest of those rules, the trapezoidal rule. The ship is taken to float upright and on even keel at a given waterline. The waterline divides the hull into a part above water and a part below, and nearly everything in hydrostatics is a property of the part below.
The displacement volume is the volume of the moulded hull below the waterline; is the displacement (a force) and the displacement mass. For a plated ship with appendages, both are increased by the shell and appendage allowance; the displacement is then equal to the weight of the ship, and to its mass. The waterplane area is the area enclosed by the waterline. The midship-section area is the immersed area of the midship section, and the largest immersed section area, wherever it lies. The centre of buoyancy B is the centroid of ; with the ship upright it lies in the centreplane, at . The centre of flotation F is the centroid of the waterplane, at ; a ship that trims slightly at constant displacement turns about a transverse axis through F. B, F and G are three different points: B lies inside the immersed volume, F in the waterplane and G wherever the distribution of weight puts it. For the Series 60 hull at its design draught, the positions computed from its surface place B 59.14 m forward of the AP and 3.49 m above the baseline, and F 56.25 m forward of the AP on the waterline, 6.50 m above the baseline (Fig. 1.18). The wetted surface , the area of the hull in contact with the water, is a surface integral rather than a volume integral, and Sec. 1.7.10 treats it.
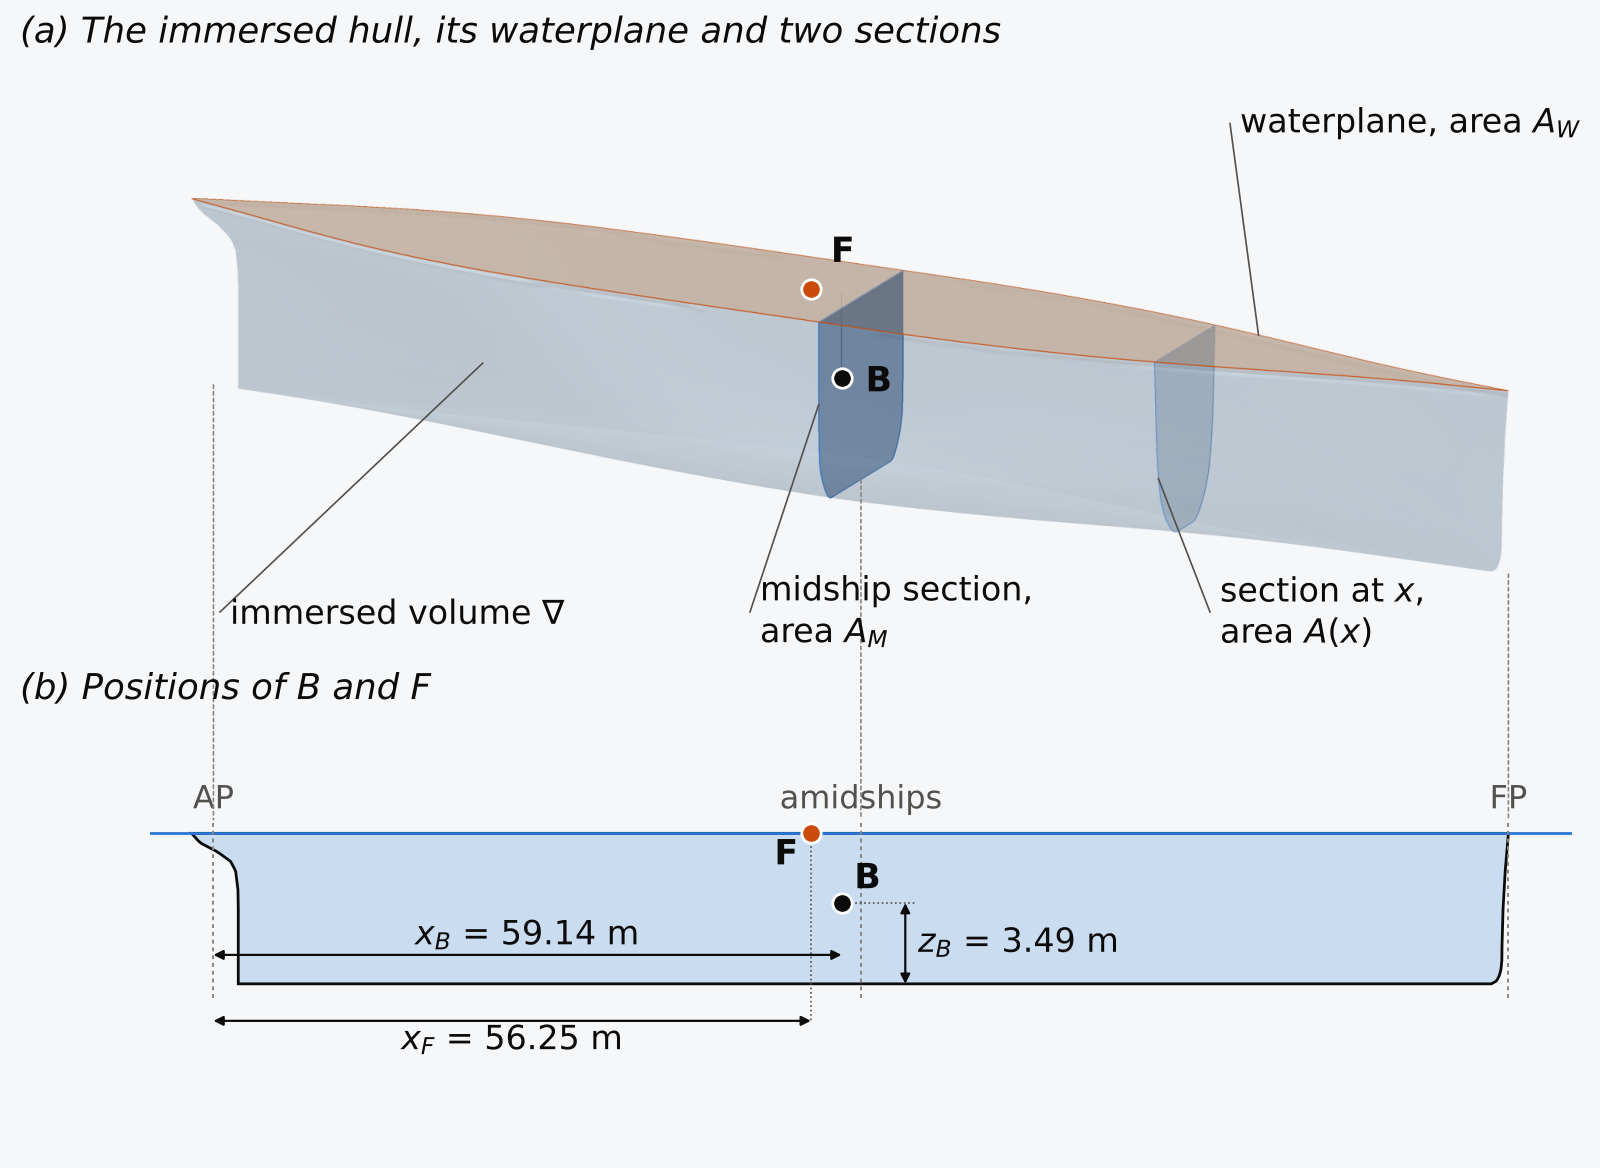
Figure 1.18 The immersed Series 60 hull at its design draught: (a) its waterplane and two of its sections; (b) the positions of B and F. Heights are drawn 2.5 times as large as lengths.
Each of these quantities is an integral over the shape. If is the immersed area of the section at (Fig. 1.18(a)) and the half-breadth of the waterline, then
where the integrals in run over the whole immersed length and is the area of the waterplane at height . The two forms of the volume integral sum the immersed volume in vertical slices, by sections, and in horizontal slices, by waterplanes; the integral for uses the second, and Sec. 2.6.3 computes the volume both ways, with a word on what their agreement does and does not check. The section areas are in turn integrals of the offsets, up to the waterline, where is the half-breadth of the hull at . Offsets are integrated to give areas, areas to give volumes, and the first moments of areas and volumes give the centres.
For the box barge these integrals are trivial: , , , and B is at half the draught, . For the Wigley hull they can still be evaluated exactly, and its centre of buoyancy is at , higher than a box’s because more of its volume lies near the waterline. For the Series 60 hull they must be computed numerically, which is the subject of Chapter 2.
The density of sea water varies with salinity and temperature. ITTC procedure 7.5-02-01-03, Rev. 03, gives, at 15 °C, 1026.02 kg/m³ for standard sea water (practical salinity 35) and 999.10 kg/m³ for fresh water24; the ITTC Dictionary still lists the older values9, 1025.87 and 999.00 kg/m³. Design calculations and most rules use 1025 and 1000 kg/m³, and these values are used throughout. Section 3.5 treats the effect of a change of density.
1.7 Coefficients of form and wetted surface
The integrals for the displacement and the centres give the size and position of the immersed volume but not its character, whether the hull is full or fine and whether its sections are U-shaped or V-shaped. A coefficient of form describes that character as the ratio of an area or a volume of the hull to that of a simple figure with the hull’s main dimensions, such as a rectangle of by for the midship section or a box of by by for the immersed volume. The box barge fills its box completely. The Series 60 hull, with full midship sections and fine ends, has 60 % of the volume of its box, and the slender Wigley hull less than half. This fullness is a good indication of the type of ship. Parts of a hull can lie outside its box, such as the cruiser stern of the Series 60 hull abaft the AP, or the sides of a hull that is wider below its waterline than at it, so the ratio of the displacement volume to the volume of the box, the block coefficient, is not in general the fraction of the box that the hull fills. The comparisons are drawn in Fig. 1.19: the midship sections and the waterplanes of the Series 60 and Wigley hulls against their rectangles in (a) and (b), and the immersed Series 60 hull in its block and in the prism of its midship section in (c) and (d).
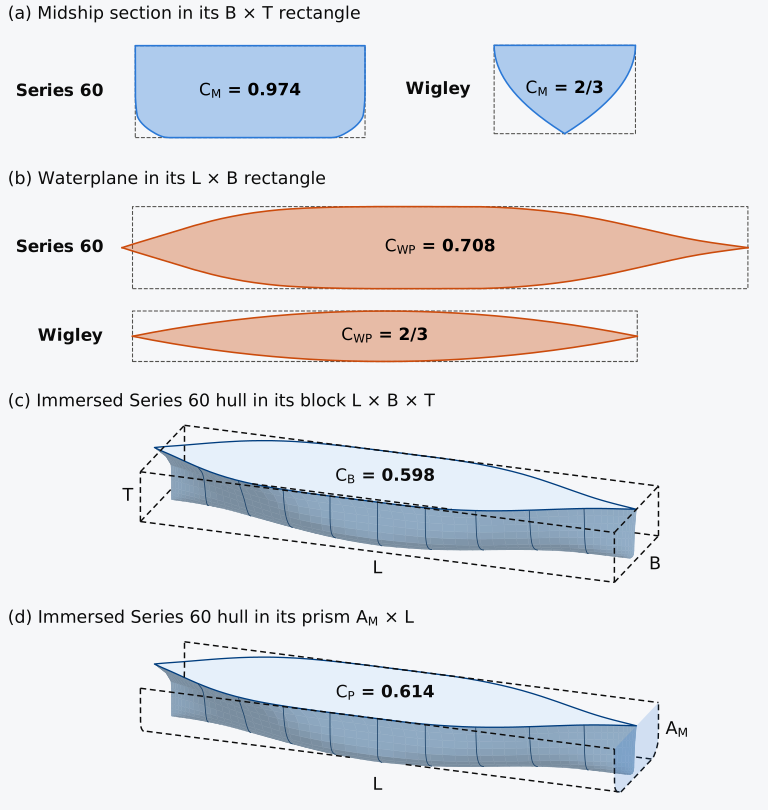
Figure 1.19 Fullness of the Series 60 and Wigley hulls: (a) midship section, ; (b) waterplane, ; (c) the immersed Series 60 hull in its block, ; (d) in its prism, . In (c) and (d) breadths and heights are drawn at twice the scale of lengths.
1.7.1 Midship-section and waterplane-area coefficients
The midship-section coefficient compares the immersed midship section with its rectangle (Fig. 1.19(a)):
Its value reflects the shape of the section (Fig. 1.20). A rectangle has . Rounding its two lower corners with a bilge radius removes of area, so , which is 0.981 when and . The Series 60 midship section, with its flat bottom and rounded bilges, has = 0.977 according to Todd20, and 0.974 on the surface built here. A semicircle has = 0.785, the Wigley’s parabolic section 2/3, and a V-shaped triangle 1/2. For normal ships is about 0.75 to 0.995, and it can be as little as 0.62 for extreme forms with a slack bilge8; most merchant ships lie near the top of that range (Table 1.3).
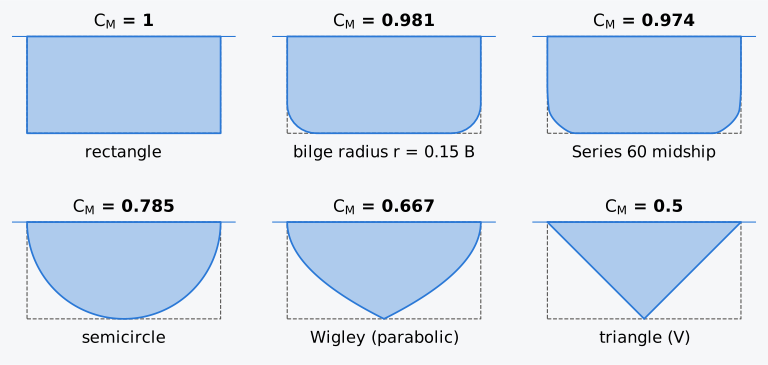
Figure 1.20 Section shapes and their midship-section coefficients. All are drawn with ; the Series 60 and Wigley sections are scaled to that ratio.
The waterplane-area coefficient compares the waterplane with its rectangle (Fig. 1.19(b)):
Its values range from about 0.65 to 0.95 at the design waterline8. The shape of the waterplane governs how far B moves when the ship heels or trims slightly, which Chapters 4 and 6 treat.
1.7.2 Block coefficient
The block coefficient compares the displacement volume with the box (Fig. 1.19(c)):
It is the ratio of the displacement volume to that of the reference box, and for a hull that lies within the box it is the fraction of the box that the hull fills. Values at the design waterline range from about 0.36 for a fine, fast vessel to about 0.92 for a slow, full bulk carrier8. Multiplied by , an assumed also gives the quickest estimate of the displacement of a ship that does not yet exist (Example 1.2).
Example 1.2. A first estimate of displacement. Adapted from Attwood4 (public domain). A ship is to be 121.92 m long, 12.80 m in breadth and 5.18 m in draught, for a speed of 13½ knots (6.9 m/s). Data from similar ships suggest a block coefficient of 0.625. Estimate the displacement, and its sensitivity to the choice of .
1.7.3 Prismatic coefficients
The prismatic coefficient compares the displacement volume with a prism whose cross-section is the midship section and whose length is the ship’s (Fig. 1.19(d)):
Multiplying the midship-section coefficient by the prismatic coefficient gives
combines two properties of the hull, how full its sections are and how its volume is distributed along the length. measures the first, and isolates the second: it measures how well the midship section is carried towards the ends. The term longitudinal coefficient, introduced by D. W. Taylor, reflects this, and is a frequently used parameter in studies of speed and power8. Since is normally less than 1, is normally larger than . Of two ships of equal length and displacement, the ship with the smaller has the larger midship section and its volume concentrated amidships, with finer ends. Two hulls with equal can still distribute their volume along the length in different ways, and because that distribution matters for resistance, trim and much else, it is described by a curve, the sectional-area curve (Sec. 1.8.1).
The vertical prismatic coefficient describes how the volume is distributed in height:
and multiplying it by the waterplane-area coefficient, as in Eq. (1.14), gives
A hull with U-shaped sections, whose waterplanes remain large down towards the keel, has a high and a relatively low centre of buoyancy; a hull with V-shaped sections has a low and its volume, and B, higher up. The box ( = 1) has , and the Wigley hull ( = 2/3) has .
1.7.4 Fullness and speed
The distribution of volume along the length matters for speed because a moving ship makes waves, and the waves it makes depend on its speed relative to its length. The measure is the Froude number,
where is the speed. A gravity wave in deep water that travels at the ship’s speed has length , so fixes the length of the waves a ship makes relative to its own length: the ratio of the two is . A speed of 20 knots (10.3 m/s) gives a 6 m speedboat = 1.34 but a 120 m ferry only 0.30, which in this sense puts the ferry closer to a 5 m rowing boat at 3 knots (1.5 m/s, = 0.22) than to the speedboat (Exercise 1.12). Geometrically similar hulls at equal Froude numbers make similar wave patterns. Over the speed range of most displacement ships the wave-making resistance rises steeply with , although not uniformly, since the curve has humps and hollows. Partly for this reason, among conventional displacement ships the faster types tend to have finer forms and lower block coefficients than the slower types, which can be full and carry more cargo for given dimensions; compare the container ships with the tankers and bulk carriers in Table 1.3. The details belong to resistance and propulsion, which lie outside hydrostatics and stability, but the coefficients of form are one link between hydrostatics and hydrodynamics.
1.7.5 Relations between the coefficients
The identities and are useful as checks, but they hold only if the same , and are used in every coefficient. Practice varies: some authors base on and others on , and may be taken at the waterline or amidships8,12. The ITTC Dictionary9 bases on and the waterline breadth, and on the largest section, . Mixing such definitions breaks the identities, and a table of coefficients is therefore incomplete unless it states which length, breadth and draught were used, whether the dimensions are moulded or extreme, and whether or was taken. Unless stated otherwise, coefficients are based on , the moulded breadth on the waterline and .
A coefficient of form can exceed 1. With taken on the waterline, is possible for a section with bulges or blisters below the waterline8, and based on exceeds 1 whenever , which requires some sections to be fuller than the midship section or a significant part of the immersed hull to lie beyond the perpendiculars. Some stability textbooks state that coefficients never exceed unity16,25; that is true only of ordinary forms. Coefficients also depend on draught, a point that is often misstated. They describe the hull up to one waterline and change, often considerably, as the ship floats deeper or lighter.
1.7.6 Typical values
Table 1.3 collects the typical values referred to above. Its ranges are assembled from four sources that do not always agree, and they are intended only for orientation.
Table 1.3 Typical coefficients of form at the design waterline.
| Ship type | , MAN (2018) | Sources | ||||
|---|---|---|---|---|---|---|
| Crude-oil tanker | 0.80–0.86 | 0.98–1.00 | 0.82–0.90 | 0.916 | 0.78–0.83 | 1, 2, 3, 4 |
| Bulk carrier | 0.75–0.84 | 0.97–1.00 | 0.76–0.85 | 0.898 | 0.75–0.85 | 1, 2, 3, 4 |
| General cargo ship | 0.60–0.75 | 0.97–0.98 | 0.61–0.76 | 0.724 | 0.70–0.85 | 1, 2, 3, 4 |
| Container ship | 0.57–0.64 | 0.96–0.98 | 0.60–0.68 | 0.740–0.748 | 0.60–0.72 | 1, 2, 3, 4 |
| Passenger and cargo-passenger ship | 0.53–0.63 | 0.90–0.97 | 0.56–0.67 | 0.687–0.725 | 0.50–0.70 | 1, 2, 3, 4 |
| Tug | 0.50–0.58 | 0.90–0.92 | 0.62–0.64 | – | – | 2, 3 |
| Frigate | 0.45–0.48 | 0.74–0.78 | 0.60–0.64 | 0.727 | – | 1, 2 |
Sources: 1, Hamlin8, moulded; 2, Tupper12, based on extreme dimensions; 3, Barrass and Derrett16, only; 4, MAN Energy Solutions26, only, shown separately by source and year (container ships: feeder and liner carriers; passenger ships: ro-pax, ferries and cruise ships). The first three coefficient columns span the values that sources 1–3 give for each type. The column gives the values of the one or two ships of each type in source 1, so it shows examples rather than ranges. Because the sources use different dimensions and date from different decades, the ranges are indicative only.
Example 1.3. A nineteenth-century Atlantic liner. Adapted from Attwood4 (public domain). The steamship Umbria was 152.400 m long, 17.374 m broad and 6.858 m in draught. It displaced 10,018.2 t, and the area of its immersed midship section was 106.84 m². Find , and .
1.7.7 Variation with draught
The coefficients change with draught (Fig. 1.21). For the Wigley hull the variation can be found exactly (Example 1.4), and and do not change with draught. The Wigley’s half-breadth is the product of a function of and a function of , so every waterline is a constant multiple of one parabola, and so is the curve of section areas along the length. Only the shape of the sections changes with draught, from nearly a triangle near the keel () to the full parabola at the design waterline ( = 2/3), and and change with it.
Example 1.4. The Wigley hull in closed form. The half-breadth of the Wigley hull is , with and ; every waterline is a parabola in and every station a parabola in . Find its coefficients at the DWL, and at any draught.
Solution.
The waterplane. On the DWL ( = 0), , and with ,
The sections. At a station, with ,
so , and the section area is also a parabola.
The volume and the coefficients. Integrating the section areas along the length,
so and .
The numbers. For our hull ( = 100 m, = 10 m, = 6.25 m), = 2777.8 m³, = 2847.2 t, = 666.67 m² and = 41.667 m². Taking moments of the waterplane areas about the baseline, with ,
Any draught. At a lower waterline (), with taken as the breadth of that waterline, , the integrals above, taken up to , give
which is plotted in Fig. 1.21(a); runs from 1/2 at the keel to 2/3 at the DWL.
Comment. A numerical integration of the half-breadth formula on a fine grid reproduces all of these values, and this check is used to test the integration routines of Chapter 2.
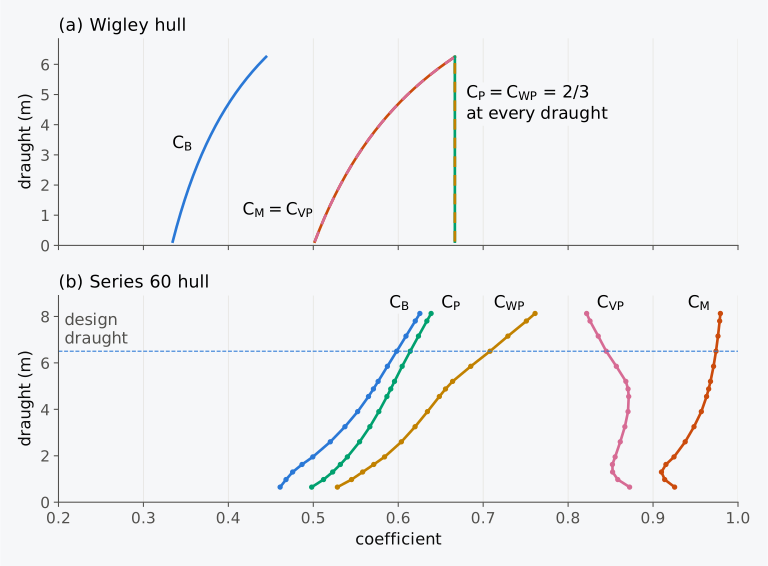
Figure 1.21 Coefficients of form against draught: (a) the Wigley hull, exact; (b) the Series 60 hull, computed from its surface with the waterline breadth at each draught.
On the Series 60 hull every coefficient changes with draught (Fig. 1.21(b)), each for its own reason. Its midship section changes little with draught once the waterline is above the turn of the bilge, so stays between about 0.95 and 0.97 over the upper half of the draught; lower down the rounded bilge takes a larger share of the section, and falls to about 0.91. Its waterplane grows steadily as the ship floats deeper, because the waterlines become fuller towards the ends, and increases from 0.620 at half the design draught to 0.708 at the design draught. , which is the mean area of the waterplanes below the waterline divided by the area of the top waterplane, rises slightly to 0.871 at 0.7 times the design draught and then falls to 0.845, because near the design waterline the top waterplane grows faster than the average of those beneath it. A coefficient quoted without its draught is incomplete, and Chapter 7 collects these draught-dependent quantities in the hydrostatic curves.
Explorer 1.1 draws the immersed midship section of the Wigley hull for a waterline set anywhere between the keel and the DWL, and plots its coefficients of form against the draught.
1.7.8 Proportions and affine distortion
The proportions of a hull are described by ratios of its main dimensions. The usual ratios8 are , from about 3.5 to 10 in ships, , from about 10 to 30, and , from about 1.8 to 5. Each ratio bears on a different property of the ship. A larger favours speed but is unfavourable for manoeuvrability, and a larger gives more initial stability27. , usually 10 to 15, bears on the freeboard and the longitudinal strength, and a larger , usually 1.3 to 2, is unfavourable for strength and for the range of stability, since a broad ship of small depth brings its deck edge into the water at a small angle of heel27. A ratio that combines size and fullness is the slenderness ratio, or Froude’s length coefficient11,
the length of the ship divided by the side of a cube of volume . The volumetric coefficient is another measure of slenderness; some texts use , which is and ranges from about 1 for long, light ships such as destroyers to about 15 for short, heavy ships such as trawlers8.
If a hull is stretched by factors , and along the three axes, every volume is multiplied by , every waterplane area by and every section area by , and so are the box, the rectangle or the prism that defines each coefficient. The coefficients , , , and are therefore unchanged by such a stretch, while ratios such as and change with it. A model and its ship, related by a single scale factor, have identical coefficients. A designer who needs a different length, breadth or draught can stretch the offsets of a good parent hull and keep all its coefficients, which is the simplest way of deriving a new form8; hulls related in this way are called affine7. The centres of an affine hull move with it7: and are multiplied by , and by . Its wetted surface follows no single factor, because the area depends on the slope of the surface as well as on its extent, and it must be computed again8. A stretch of 1.2 in length multiplies the wetted surface of the Wigley hull by 1.199, nearly the stretch itself, because the waterlines of a slender hull make small angles with the centreline. A stretch of 1.2 in breadth multiplies it by 1.058, a stretch of 1.2 in draught by 1.149, and a uniform scale of 1.2 by 1.44.
Example 1.5. The Series 60 hull: coefficients, centres, proportions and model. (a) From Todd’s particulars, = 121.92 m, = 16.256 m, = 6.502 m and a displacement of 7807 tons, each of 35 ft³ of sea water, check his block coefficient and slenderness ratio, and compute the proportions, taking the depth of the surface, = 9.754 m. (b) Compute , , and from the surface. (c) Locate the centres of buoyancy and flotation, and compare the centre of buoyancy with Todd’s. (d) Find the main particulars of a model of the hull at the size of Todd’s models, which were 6.096 m long.
1.7.9 Ship types and their forms
The form of a hull depends on the purpose of the ship, and principally on its speed. Figure 1.22(a) shows the midship sections of four types, each drawn with the breadth–draught ratio and the midship-section coefficient of a typical ship of that type in Hamlin’s table8. A slow ship, such as a tanker or a bulk carrier, meets mainly frictional resistance and can afford a full hull, with a high block coefficient, often obtained with a parallel middle body of perhaps 15–20 % of the length12; its midship section is almost rectangular, with a small bilge radius, as the tanker’s of 0.996 shows. As the design speed rises, the parallel middle body is shortened first, which lowers without changing ; at still higher speeds is reduced too, usually by a rise of floor with rounded bilges12, which is how the frigate’s section is drawn. Within each type, a higher service speed generally means a lower block coefficient25.
The shape of the sections matters as well as their area. U-shaped sections, rounded at the bottom with nearly vertical sides, give a high vertical prismatic coefficient; V-shaped sections, relatively sharp at the bottom with straight, flaring sides, give a low value9,12. V-sections are generally favourable to stability and seakeeping but often cost resistance or propulsive efficiency, and a ship that must work in heavy weather needs a large deadrise forward, with little flat bottom, to avoid slamming8. A small bilge radius with a bilge keel at the turn of the bilge increases the damping of roll, but a small radius also increases the wetted surface8.
The ends are named by their profiles (Figs. 1.22(b) and 1.22(c)). A stem may be vertical (plumb), raked, or a clipper stem, which curves forward above the waterline with a large overhang; a bulbous bow projects below the waterline, sometimes beyond the FP. A stern may be a cruiser stern, with a convex profile, a transom stern, or a counter stern, whose deck extends abaft the rudder with an appreciable overhang9. Of the four ships of Fig. 1.22(a), the container ship has a bulb whose area is 8.3 % of the midship-section area and the general cargo ship a bulb of 4.0 %, while the tanker and the frigate have none8.
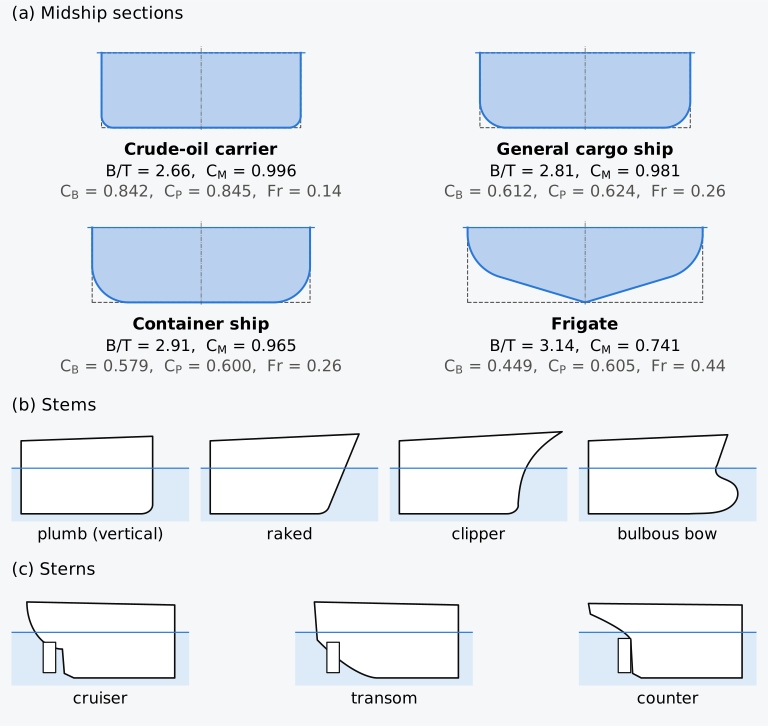
Figure 1.22 Forms of ships: (a) midship sections of four types, with the ratios and coefficients of a typical ship of each type in Hamlin8 (ships 10, 5, 3 and 18), each coefficient rounded to three decimals, so that may differ from in the last digit (for the frigate, 0.449/0.741 = 0.606); (b) stems; (c) sterns. The sections are constructed shapes, not the ships’ own. Sketches, not to scale.
The ships considered here are all monohull displacement ships, supported only by buoyancy. Craft that reach high speeds by dynamic lift, such as planing craft and hydrofoil craft, or by lift from fans, such as air-cushion vehicles, need a separate treatment of their stability at speed, although at low speed, hullborne, their problems are like those of displacement ships. Multihulls, among them catamarans and small-waterplane-area twin-hull (SWATH) ships, operate in general as displacement craft, but their stability also has features of its own13.
1.7.10 Wetted surface
The wetted surface is needed to estimate the frictional resistance, the paint for the bottom and, with the area of the topsides, the weight of the shell plating8. The moulded hull makes up about 99 % of the wetted surface of a full single-screw ship and about 85 % of that of a fine, fast ship with several screws; appendages make up the rest8. The values below are for the moulded hull.
The traditional method works section by section. The girth of a section is its length around its contour between the two points where it meets the waterline9, and its half-girth , from the keel on the centreline to the waterline, is half of that8 (Fig. 1.23(a)). Plotted against , the half-girths form the transverse expansion of the hull (Figs. 1.23(b) and 1.23(c)), and twice its area,
approximates the wetted surface8, usually to within about 2 %. The second integral is the length of a section that can be written as ; a flat of keel adds its half-width.
The approximation is always low, because wherever the waterlines are inclined to the centreline, at the angle with , a strip of the surface between two neighbouring sections is wider than the spacing of the sections. The exact area of a hull surface is an integral over its projection on the centreplane8,
and the transverse expansion leaves out the term in . The traditional correction multiplies the girth by , the secant of the waterline angle8. Applied to each element of the girth with its own angle, it replaces the integrand by
which is too large by the last term, so the corrected area is slightly high8. The error matters only where the surface is inclined in both directions at once, as at the turn of the bilge near the ends. Today the surface integral is evaluated directly, or the triangles of a mesh are summed, as in Example 1.6 for the Series 60 hull.
To compare ships of different sizes, the wetted surface is made non-dimensional by the wetted-surface coefficient9
For thirteen ships of different types it lies between about 2.5 and 3.1 and varies with the breadth–draught ratio8. Two approximations from the nineteenth century, quoted by Attwood4, are still useful as checks. Denny’s formula, written in ITTC symbols,
is dimensionally consistent and holds in any units. Taylor’s, with in tons of 35 ft³ of sea water and in feet, is equivalent to a constant wetted-surface coefficient, = 2.637, and in that form it holds in any units.
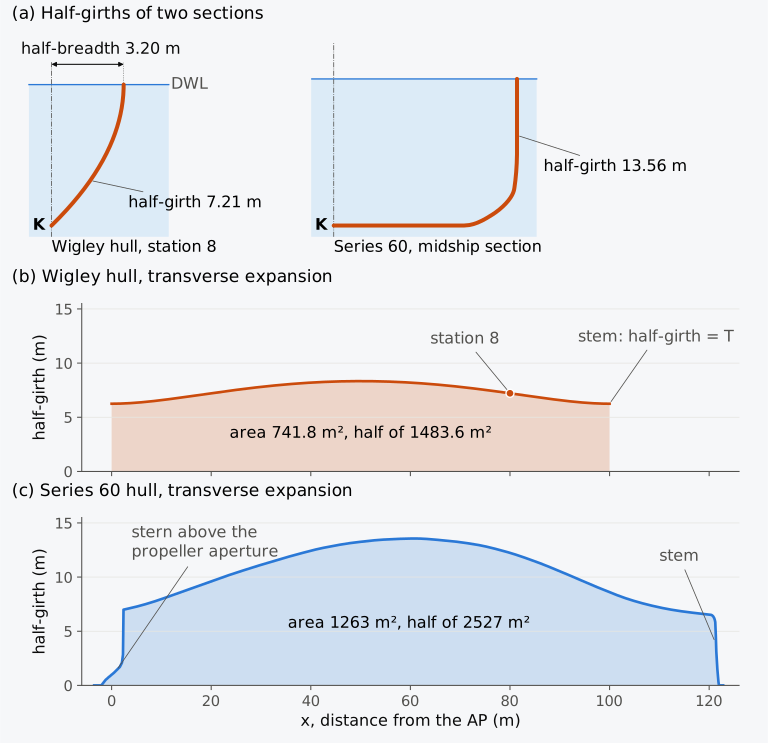
Figure 1.23 Half-girths and the transverse expansion: (a) the half-girths of two sections; (b) the transverse expansion of the Wigley hull and (c) of the Series 60 hull. Twice the area under each curve approximates the wetted surface.
Example 1.6. The wetted surface of the Wigley and Series 60 hulls. (a) Find the half-girths of the Wigley hull ( = 100 m, = 10 m, = 6.25 m, = 2777.8 m³) at its eleven stations, and from them its wetted surface by the transverse expansion, with the trapezoidal rule. Compare the result with the exact surface integral, 1487.9 m². (b) Find the wetted-surface coefficients of the Wigley hull and of the Series 60 surface ( = 121.92 m, = 6.502 m, = 7709.1 m³), whose mesh gives a wetted surface of 2542 m², and compare both surfaces with Denny’s and Taylor’s approximations, and the Series 60 surface with Todd’s 2534 m².
1.7.11 Coefficients of form (Calculator 1.1)
Calculator 1.1 gives the coefficients of form, the proportions and the displacement of a hull from its main dimensions and its volume, by the definitions given above. The volume may be given directly, through the displacement mass, or, as at the start of a design, through an assumed block coefficient; in that case the calculator also shows how much the displacement changes with each 0.01 of , as in Example 1.2. The midship-section and waterplane areas are optional, and the coefficients that need them are left out when they are not given.
Choose a worked example or the box barge to load its numbers, or enter those of your own hull. The question appears above the inputs and changes as you change the numbers, and the working is set out in steps, as in the examples: each value is rounded as it is printed and used in that form in the next line, so that every line can be checked by hand. The water is sea water of 1025 kg/m³ unless you change it. The calculator checks the identities and and says when a result is unusual: a coefficient above 1, or a block coefficient larger than the midship-section or waterplane coefficient, which only some forms can have.
1.8 Sectional-area and Bonjean curves
1.8.1 The sectional-area curve
The coefficients of form describe the fullness of a hull in a few numbers, but, as we have seen, two hulls with equal can still distribute their volume along the length in different ways. If the immersed area of every section is plotted against its position , the whole underwater hull is reduced to a single curve, the sectional-area curve (SAC), shown for the Series 60 hull in Fig. 1.24(a). The area under it is the displacement volume, and the -coordinate of its centroid is the LCB. If both axes are made non-dimensional, against , the area under the curve is the prismatic coefficient:
In this form the area under the curve is the fraction of a square of side 1; Fig. 1.24(b) shows the curves of the three reference hulls drawn in this way. The block coefficient can be read from the curve as well. Drawn with its dimensions, the area under the curve is the fraction of a rectangle of length and height , and the fraction of a rectangle of height . The heights of the two rectangles differ by the factor , which is Eq. (1.14) read from the curve. For the Series 60 hull the two fractions are 0.614, with = 102.97 m², and 0.598, with = 105.70 m².
The curve is formed from the sections of the hull (Fig. 1.24(a)). Each immersed section, shaded in the view above, has an area, and each area becomes one point of the curve below it; between the stations the curve is continued by the sections in between. The dashed line marks the centroid of the area under the curve, which is the LCB. Animation 1.1 sweeps a station plane along the hull and traces the curve point by point.
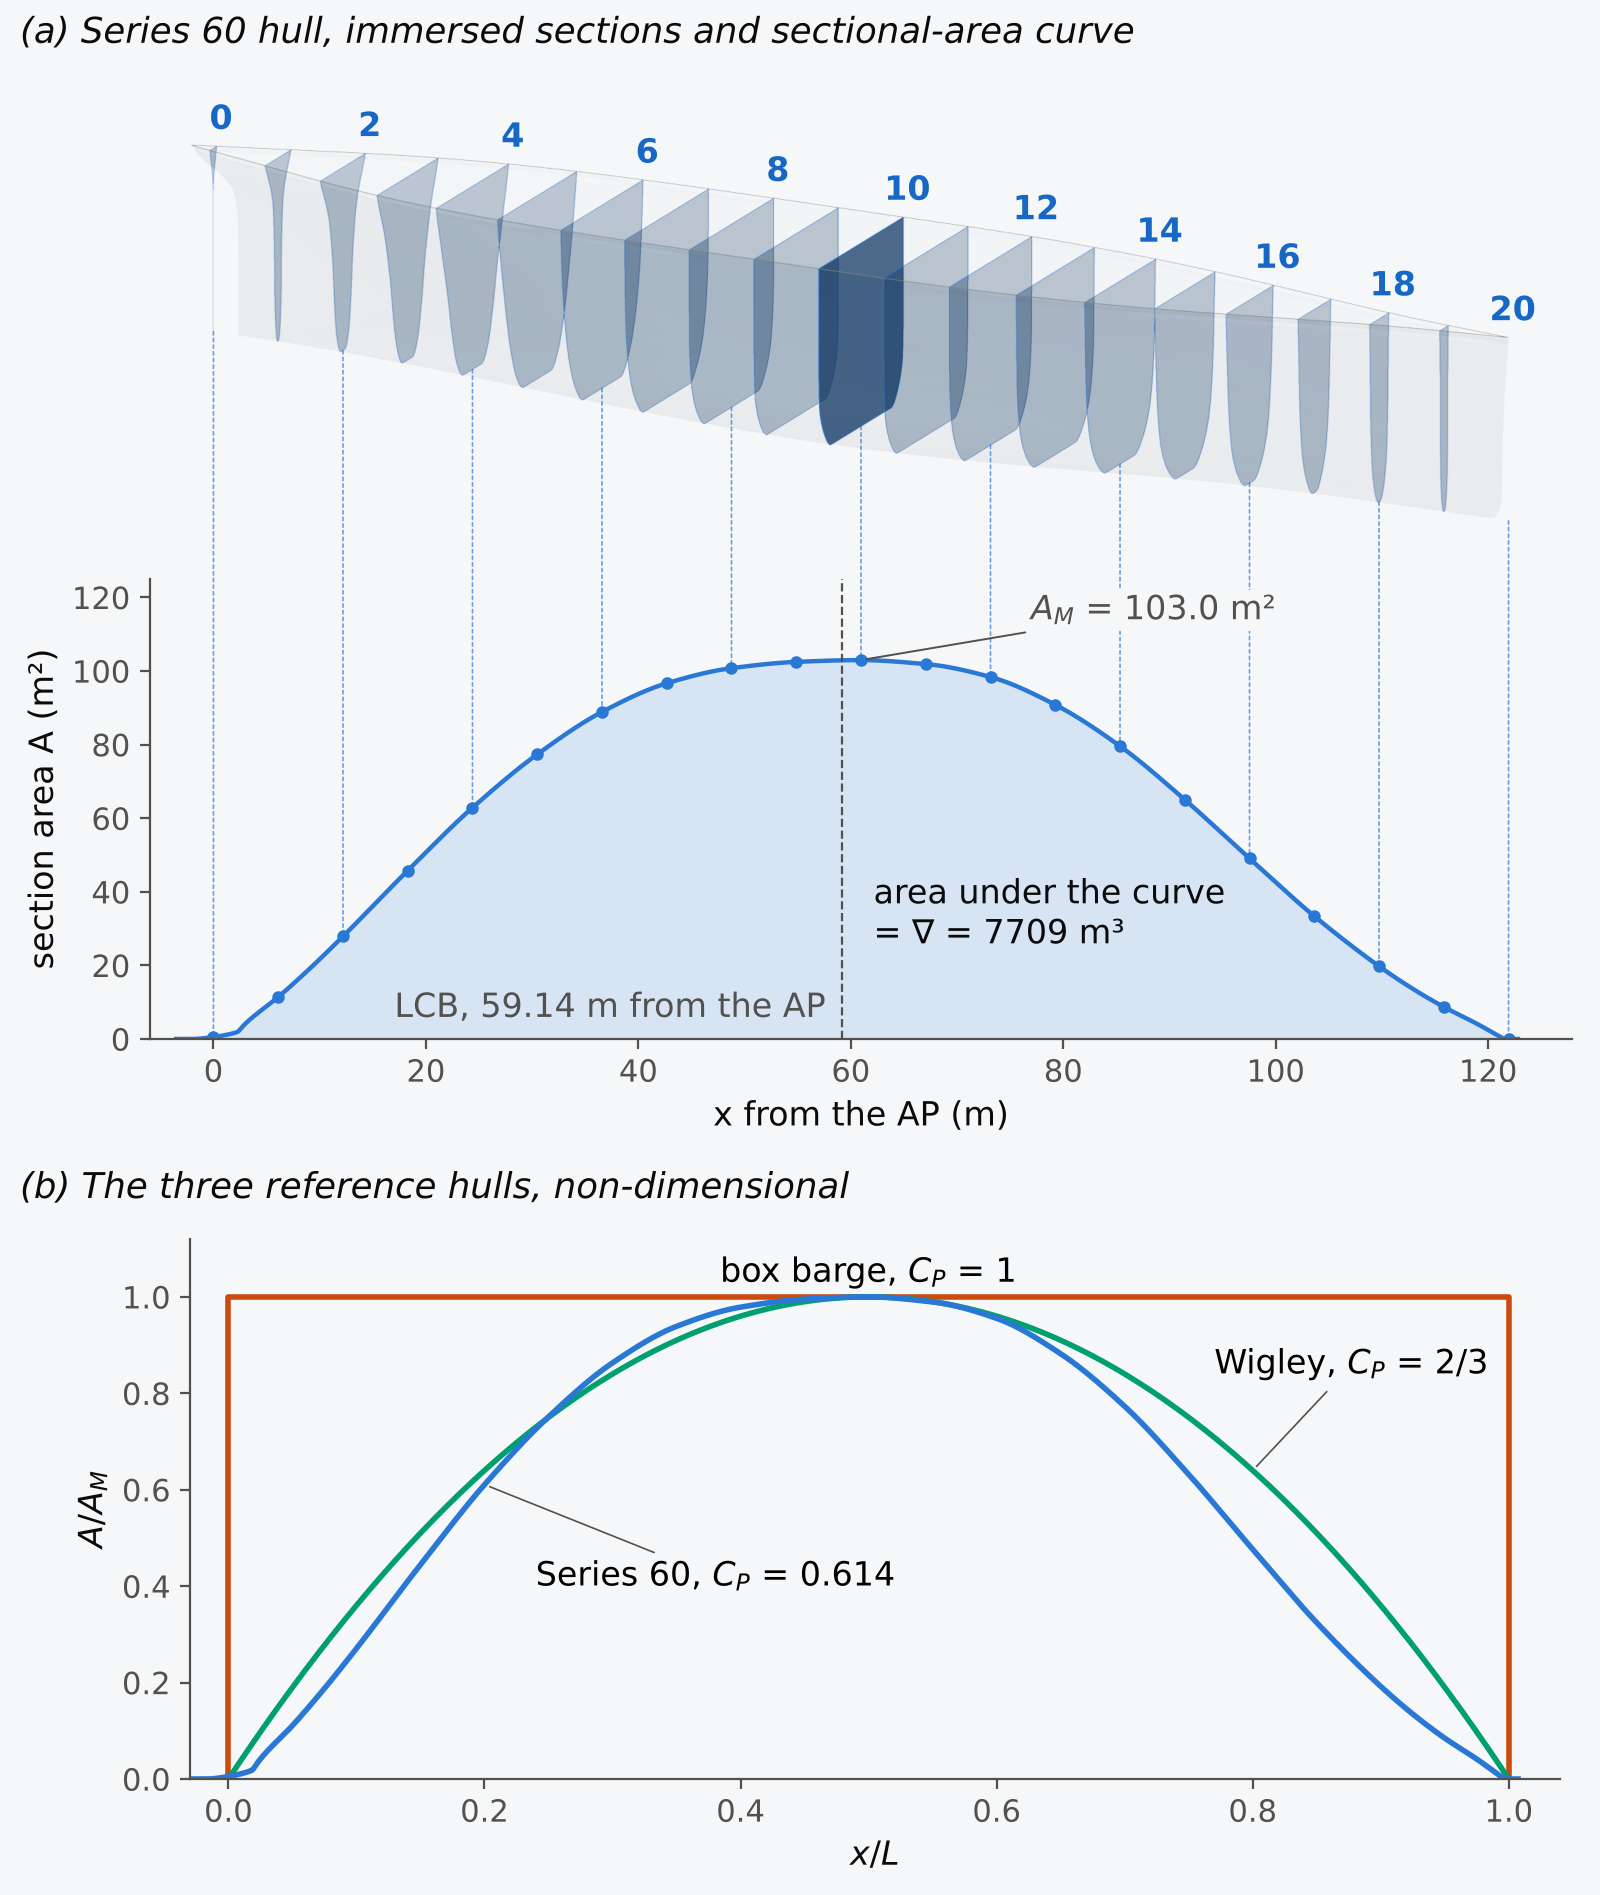
Figure 1.24 Sectional-area curves: (a) the immersed sections of the Series 60 hull at stations 0 to 20 and the curve they form; (b) all three hulls in non-dimensional form, where the area under each curve is . Heights in the 3-D view are drawn 2.5 times as large as lengths.
Animation 1.1 A station plane swept along the Series 60 hull from the stern to the bow. Beside the profile, the section that the plane cuts is drawn to true scale with its immersed area. Below, that area becomes one point of the sectional-area curve, and the area under the curve so far is the volume aft of the plane. At the end the curve encloses the displacement volume, 7709 m³, whose centroid, the LCB, is 59.14 m from the AP; the midship section has an area of 103.0 m². Heights in the profile are drawn 2.5 times as large as lengths. No sound; 13.5 s.
The shape of the curve reflects the shape of the hull, but only through the area of each section. A parallel middle body, where the sections are identical, gives the curve a flat top. The converse does not hold, because a flat top shows only that the section areas are constant, and sections of different shape can have equal areas, so the shapes of the sections must be compared to establish a parallel middle body. The tapering parts of the curve are the run aft and the entrance forward. The Series 60 curve has no flat top, which shows that the hull has no parallel middle body, and it is not symmetric about the midship section. The prismatic coefficients of its after and forward halves, and , each defined like with the volume and length of that half9, are 0.647 and 0.581, against 2/3 for both halves of the Wigley hull. More of its volume lies aft, and its run is fuller than its entrance, which the overall = 0.614 does not show. Because the SAC shows directly how volume is distributed along the ship, it is one of the principal factors that determine resistance, and a primary tool in shaping a hull21.
For the waterline, plotting its half-breadth against gives the curve of half-breadths, . Its area, doubled, is the waterplane area; its centroid gives the LCF; and Sec. 2.5 integrates it again for the second moments of the waterplane. The curve of half-breadths looks like the SAC, and the two are easily confused. Drawn as and against , they coincide for the Wigley hull, where both are , but not for the Series 60 hull. At station 2 (Todd’s station 18), 12.19 m forward of the AP20, its design waterline still has a half-breadth of 0.54 , but the section has an area of only 0.27 . In this form the area under the curve of half-breadths is , 0.708, and the area under the SAC is , 0.614.
The integrals for the volume, the LCB and the prismatic coefficient run over the whole immersed length, not only from AP to FP. On the Series 60 hull the stem meets the FP at the waterline, and the cruiser stern places only 0.42 m³ of the immersed volume aft of the AP, less than 0.01 % of the displacement. On other hulls the volume outside the perpendiculars is larger and easily forgotten. A bulbous bow swells the curve at the bow and can extend it forward of the FP8. Where a bulb reaches the FP, the curve has a finite ordinate there9, and an immersed transom ends it at a finite ordinate.
Where a parallel middle body meets the entrance and the run, the curve bends more sharply, and these regions are the shoulders8. The slope of the curve at each end is one of its design parameters: Taylor’s mathematical sectional-area curves of 1915 were fixed, for each half of the ship, by its prismatic coefficient, the slope at its end and the curvature amidships8. A long, concave tail at an end adds length but little volume, and resistance estimates and coefficients of form are then sometimes based on an effective length. It ends where a tangent to the tail, drawn from the top of the midship ordinate, reaches the base of the curve8. For many single-screw ships the after end found in this way falls near the AP, and the forward end can be found likewise where a bulb projects forward of the FP8.
1.8.2 The design trapezium
In preliminary design the SAC is often built up from simple segments. The simplest replaces the curve by a trapezium of equal area (Fig. 1.25): a rectangle of height over the parallel middle body, with a straight taper over the entrance, of length , and over the run, of length . Its proportions are set by the prismatic coefficients of the two halves of the ship, for the after half and for the forward half. Since the two halves together make up the whole volume and the whole length, the overall prismatic coefficient is the mean of the two, ; for the Series 60 hull, . The area of the forward half of the trapezium is , and setting it equal to gives ; similarly . The parallel middle body is what remains, .
The trapezium is the sectional-area curve of a simple solid: a prism of the midship section over the parallel middle body, with a wedge at each end over which the section area falls linearly to nothing. Kirk’s block model for estimating the wetted surface is such a solid4. It has the length, the displacement and the midship-section area of the ship, rectangular sections as deep as the mean draught, and an entrance and a run of equal length, each, so its sectional-area curve is the trapezium with .
A straight taper fills half of the rectangle over its own length, so it has a prismatic coefficient of 1/2. An entrance or run of any other shape has a segment prismatic coefficient, or , defined like over its own length. Many are fuller than a straight taper on average, with values above 1/2, as on both hulls of Fig. 1.25, although the curve may fall below the taper near the ends; hollow ends with values below 1/2 also occur. Balancing the areas as for the trapezium gives
which reduces to the trapezium for . It follows that the trapezium needs and of at least 1/2, since otherwise a straight taper would be longer than half the ship; a fine hull with smaller values cannot be built from straight tapers and needs hollow ends. It also follows that where the ends are fuller than straight tapers, the trapezium overstates the parallel middle body, and where they are hollow it understates it. For the Series 60 hull the trapezium has a run of 43 m, an entrance of 51 m and a parallel middle body of 28 m, but the section area stays within 0.5 % of over only about 10 m (Fig. 1.25(b)). Between those points and the perpendiculars, the run and entrance have segment prismatic coefficients of about 0.61 and 0.55. Todd20 takes the entrance and run of this parent as the two halves of the ship, since it has no parallel middle body. The trapezium therefore distributes area consistently with and but does not predict the parallel middle body.
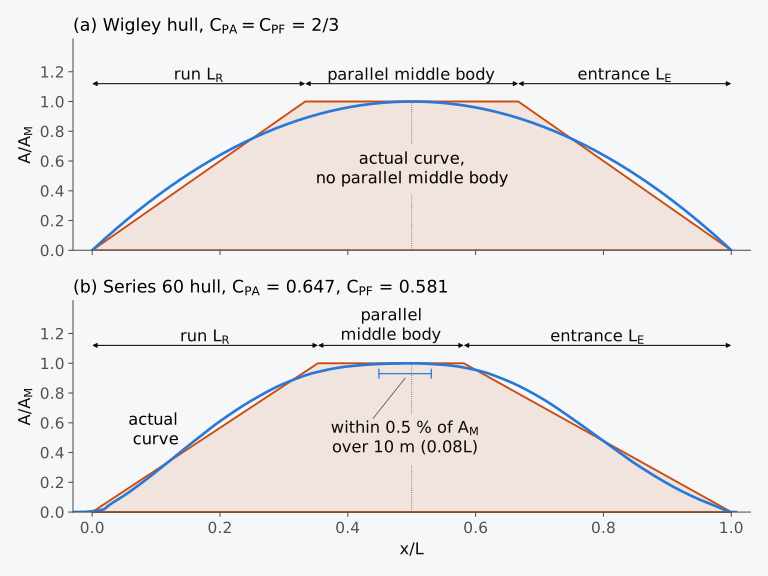
Figure 1.25 The design trapezium: (a) the Wigley hull; (b) the Series 60 hull, with the length over which its section area stays within 0.5 % of marked.
For the Wigley hull, , and the trapezium has a run, a parallel middle body and an entrance of a third of the length each, although the parabolic SAC has no parallel middle body. As on the Series 60 hull, the difference arises because the ends are fuller than straight tapers.
Where the hull is to have no parallel middle body, the trapezium can be replaced by a triangle of equal area whose base is the length . Its height is , so for its apex stands above the midship ordinate, and the triangle is a construction for placing the volume rather than a sketch of the curve. The centroid of a triangle lies at the mean of the -coordinates of its corners, so an apex at puts the centroid at the required LCB. For the Series 60 hull the ordinate of the apex is 126.46 m², or 1.228 , at 55.5 m from the AP. The faired curve of the hull lies below the triangle within about 13 m of the apex and near the ends, and above its sides in between.
Holtrop and Mennen28 use a quantity related to the run of the trapezium, the “length of the run”, in their resistance regression, in which , and lcb are based on the waterline length:
where lcb is the position of the centre of buoyancy forward of as a percentage of . For a centre of buoyancy at mid-length the formula reduces to the trapezium’s . For the Series 60 hull on the waterline basis ( = 123.98 m, = 0.604, lcb = −0.64) it gives a run of 47.1 m. The trapezium on the same basis, with = 0.619 for the half of the waterline length aft of its middle, gives = 47.2 m. The designer fairs a smooth SAC of the required area and centroid over the trapezium or the triangle and refines it, and the hull, until the design is satisfactory.
Explorer 1.2 starts from the design trapezium of the Series 60 hull and redraws the curve, with the lengths of the run, the entrance and the parallel middle body given by the area balance of Eq. (1.21), for any prismatic coefficients of the two halves and any segment prismatic coefficients of the run and the entrance.
1.8.3 Bonjean curves
The SAC describes the hull at one waterline, but a ship does not always float level; it trims, it hogs and sags, and in a seaway the water surface along its side is a wave. Each of these cases needs the area of each section up to any height. For the section at , the immersed area up to height is
where is the half-breadth of the section at height ; where the section is not a single curve, as at a bulb or a skeg, is the total immersed half-width at that height. The first moment of the immersed area about the baseline is
Plotted against for every station, these areas are the Bonjean curves, and their moments are often drawn with them7,8 (Fig. 1.26).
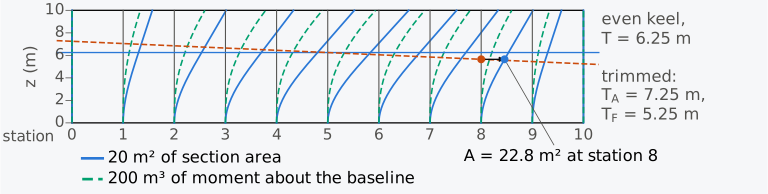
Figure 1.26 Bonjean curves of the Wigley hull: section areas (solid) and their moments about the baseline (dashed), with the even-keel waterline and a waterline trimmed by the stern ( = 7.25 m, = 5.25 m).
Bonjean curves can be used for any waterline, level or not. To use them, find where the waterline crosses each station line, read across horizontally at that height to the station’s curves, and read off the area and its moment. Integrated along the ship, the areas give the volume, and with the lever its longitudinal centre; the moments give the height of the centre of buoyancy above the baseline, in the ship’s axes7,8,
where is the height of the waterline at station . In Fig. 1.26 the trimmed waterline crosses station 8 at 5.65 m, and the area there is 22.8 m². Because each curve is drawn offset from its station line, the point where the waterline happens to cross a curve has no meaning; the reading is always taken across from the station line. Drawn on a profile of the ship, each from its own station line as in Fig. 1.26, Bonjean curves make it easy to draw a trimmed waterline across them, although their scales can be hard to tell apart where the curves overlap. Drawn instead from one vertical axis with a common scale of draught, the forebody curves to one side and the afterbody curves to the other, they are more compact8. Equations (1.23) and (1.24) give the full section area and its moment, on both sides of the centreplane. Some sources tabulate half-areas and half-moments7, and a missing factor of 2 is a common error. Exercise 1.10 uses the Bonjean curves of the Wigley hull at this trimmed waterline, and Chapter 7 uses them further.
1.9 Hull forms in industry today
Everything described so far was developed for work on paper, and most of it is still in use in a changed form. The lines plan is cut from a surface model, the table of offsets is generated from it, and the coefficients and the sectional-area curve have become inputs to the design rather than results. The practice described here is that of 2026, and the section is revised at each release. Programs are named only as documented examples of methods that many systems share.
1.9.1 Design on a surface model
A new hull is now usually designed as a surface in a computer, and the curves of its lines plan are sections cut from that surface. Many hull-design programs represent the surface by NURBS patches. Orca3D, which works inside the Rhino modeller, creates the hull “as a NURBS surface” and updates its sections as the surface is modified29. MAXSURF works with NURBS surfaces cut along curves that lie on them, and with meshes, and can fit NURBS surfaces to point data30. Other programs use subdivision surfaces, in which a coarse net of control points is refined repeatedly towards a smooth limit surface; the open-source program FREE!ship uses them in place of NURBS31. Unlike a NURBS patch, a subdivision surface is not tied to a rectangular net of control points, so a whole hull can be modelled as one surface.
Fairing is still a matter of judgement, but it is now done on the surface, at full size, so the limit set by the scale of a drawing no longer applies. Curvature can be plotted as a graph along any curve of the surface32, and in a zebra analysis the surface reflects a set of parallel stripes. Across a joint between two patches the stripes jump sideways if the patches only meet, turn sharply if they share a tangent but not a curvature, and continue smoothly if the curvature is continuous as well33.
In parametric design the hull is generated from parameters, among them the main dimensions, the coefficients of form and the sectional-area curve, and a change of parameter regenerates the whole surface. In the CAESES system, for example, the sectional-area curve is modelled parametrically and then transformed by Lackenby’s method, which moves sections along the ship, until the prismatic coefficient and the longitudinal centre of buoyancy reach their target values34. The coefficients of form and the sectional-area curve then become inputs to the design rather than results read from a finished lines plan, and an optimization program can vary them while flow calculations evaluate each variant35.
1.9.2 Exchange of geometry and meshes
A hull model passes between programs for design, analysis, classification and production, often from different vendors. The STEP family of standards has an application protocol for ship moulded forms36, ISO 10303-216:2003, which ISO last reviewed and confirmed in 2025. In practice hull shapes are still widely exchanged as NURBS entities in IGES files, and transfer through such neutral formats can lose information37. For flow calculations, and in some stability programs, the surface is converted to a triangulated mesh, often in the STL format. The mesh generator snappyHexMesh of OpenFOAM builds its grids from such surfaces38.
1.9.3 Measured hulls and benchmark hulls
The hull of a ship in service may differ from its drawings, or no usable drawings may exist. Its shape can then be measured by laser scanning while the ship is out of the water, and converted to a surface model for hydrodynamic calculations39; marine equipment suppliers offer such scans of whole hulls in dock40.
Research on ship flows relies on a few modern benchmark hulls whose geometry is published with model-test data. The KRISO container ship (KCS) and the KVLCC2 tanker were distributed as IGES surfaces for the SIMMAN 2014 workshop on manoeuvring41,42. The Japan Bulk Carrier (JBC) was distributed for the Tokyo 2015 workshop on CFD in ship hydrodynamics43. These pages state no licence for the files, so the three hulls are cited but not reproduced, and the Series 60 surface used throughout is built from Todd’s offsets, which are not subject to copyright in the United States (Notes on the data).
1.10 From hull geometry to stability calculations
You now have a hull in a form that can be integrated, the axes in which to do it, and the integrals for the volume, the waterplane and the centres written down but, for the Series 60 hull, not yet evaluated. Figure 1.27(a) shows where those integrals lead and which chapter does each part of the work. A hull is defined by a lines plan, a table of offsets, a mathematical surface or a mesh, and from any of these half-breadths can be taken. Integrated across the hull, they give section and waterplane areas, and integrated along it, volumes; moments taken in both integrations give the centres, as ratios of moments to areas or volumes, and the second moments. These results give the quantities on which the three requirements of a floating ship depend: the draught at which the ship floats, the position of B, how far B moves when the ship heels and, later, the whole curve of righting levers. The last step either combines the results, as Chapter 4 does for small angles of heel, or repeats the integrals at each angle of heel, as Chapter 8 does for GZ.
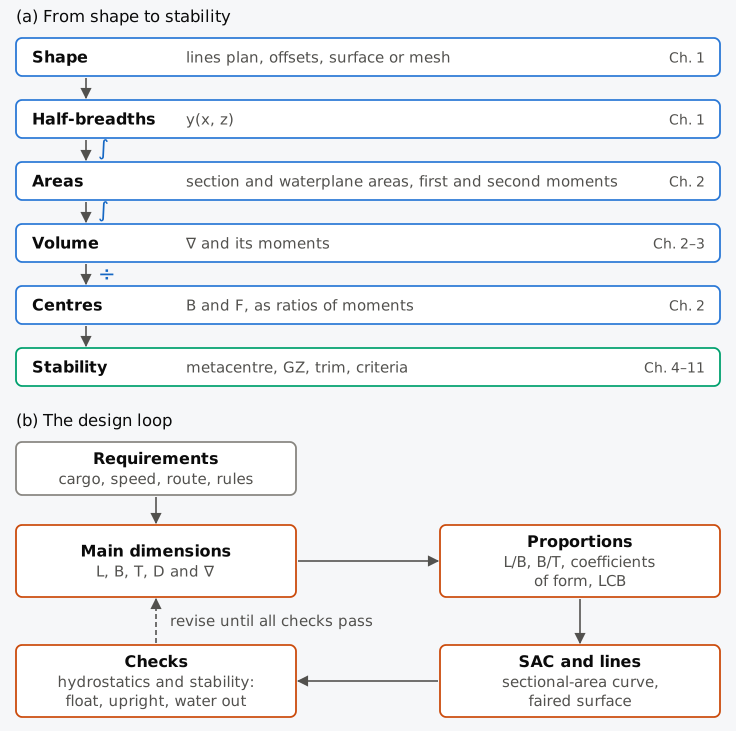
Figure 1.27 (a) From hull shape to stability: integrals (∫) give areas, volumes and their moments, and ratios (÷) give the centres. (b) The design loop, in which the shape is chosen, checked and revised.
Seen from the designer’s side, these quantities form a loop (Fig. 1.27(b)). A design starts from requirements: what the ship must carry, at what speed, on what route and under which rules. From these come the main dimensions and a first displacement, as in Example 1.2, then the proportions and coefficients, then a sectional-area curve and a faired hull, and then the hydrostatic and stability checks of the later chapters. If a check fails, the loop is repeated. Today the loop runs on a parametric surface model, but the steps follow the traditional sequence.
Foreseeing the losses of Vasa and Captain would have required the position of B at every angle of heel, which is an integral over the immersed shape, including the part of the hull above the original waterline that is immersed as the ship heels, and the position of G, which is a sum over every weight on board. A test at small angles of heel supplies neither the shape of the hull above the waterline, which determines how B moves at large angles, nor the distribution of weight, which fixes G. Chapter 8 computes the whole curve of righting levers from them. The position of B requires a description of the hull such as those given in this chapter, and the integrals of Fig. 1.27. In Captain’s day the integrals were evaluated by hand, from offsets, with Simpson’s rule; today they are evaluated by computer, from a surface model or a mesh. In either case a real hull is not a formula that can be integrated analytically, and the integrals must be evaluated numerically. Chapter 2 starts from this point. It integrates tables of offsets, the Series 60 table among them, with the trapezoidal rule and Simpson’s first rule, and it shows how far the result of such an integration can be trusted.
Summary
A ship must float, float upright and keep the water outside, limiting the flooding if it is damaged, within the conditions for which it is designed. The first two requirements depend on two points: G, set by the distribution of weight, and B, the centroid of the immersed volume, set by the shape of the hull. Captain was lost in a heel that its hull above the water could not resist, so the description must cover the hull above the waterline as well as below it.
A hull is measured by its principal dimensions, moulded or extreme, with lengths between the perpendiculars and heights from the baseline; its draughts are read from the marks on its side. Positions, heel and trim are given in ship-fixed axes with stated sign conventions, and data from a source that uses other conventions can be used only after conversion. The chapters that follow work on three reference hulls: a box barge, the Wigley hull, defined by a formula, and the Series 60 hull, built through Todd’s offsets.
A curved hull is described by a lines plan with its table of offsets, by a surface of splines, B-splines or NURBS, or by a closed mesh. A table of offsets fixes the hull only at the tabulated points, and the accuracy of a mesh depends on the size of its triangles. From such a description the displacement volume, the waterplane area and the centres B and F are integrals over sections or waterplanes. The coefficients of form describe the fullness of the hull, and the wetted surface is found from the half-girths of the sections or summed over a mesh. A coefficient can be used only with the length, breadth and draught on which it is based and at the draught to which it refers, because the coefficients change with draught. The area under the sectional-area curve is the displacement volume and its centroid is the LCB; Bonjean curves give the area of each section up to any waterline, level or trimmed.
Notes on the data
Series 60. Todd’s report is a work of the United States government and is not under copyright in the United States; its offsets are reproduced with the chapter’s scripts. The values given here are those of the surface built from them, and differ slightly from Todd’s published particulars, as the comparison below shows.
Typical values. The ranges of Table 1.3 come from sources of different dates and dimension conventions, and are for orientation only. The midship sections of Fig. 1.22(a) are constructed to the breadth–draught ratios and midship-section coefficients of ships in Hamlin’s Table 2, not drawn from those ships.
Wetted surface. The Series 60 value, 2542 m², is the area of the triangulated mesh below the DWL; a mesh with four times as many triangles changes it by less than 0.03 %. The Wigley value, 1487.9 m², is the exact surface integral evaluated numerically, and the transverse expansions are computed from the formula and surface used for the other quantities of this chapter.
Agreement of the surface with Todd’s hull
The surface is drawn through the offsets of Todd20. Todd gives them at 25 stations (every station, with half stations near the ends) and at eight heights from the baseline to 1.5 times the design draught, each as a fraction of the largest half-breadth of its waterline, and numbers the stations from 0 at the FP; his station is station here. Each station is drawn through its offsets as a smooth curve that leaves the flat of keel horizontally, and each waterline through the stations as a shape-preserving cubic that ends on Todd’s stem and stern contours (his Figure 11), including the radius of 0.97 m that rounds the stem into the keel. The AP station enters the hull at 5.79 m, where the stern contour crosses it, and the FP station at the design waterline. Each is taken into the waterlines gradually, up to the next height at which Todd gives it a non-zero offset, and the waterplane area has no step where it enters. A flat deck, without sheer or camber, is placed at 1.5 times the design draught, at = 9.754 m. Table 1.4 compares the surface with the particulars that Todd tabulates; the section areas at all 25 stations also agree with his area fractions to within 0.003 of .
Table 1.4 The Series 60 surface against Todd20, at the design draught.
| Quantity | Todd20 | Surface |
|---|---|---|
| Displacement volume | 7807 tons (7737.4 m³) | 7709.1 m³ |
| 0.60 | 0.598 | |
| (Todd’s ) | 0.977 | 0.974 |
| 0.614 | 0.614 | |
| , | 0.581, 0.646 | 0.581, 0.647 |
| 0.706 | 0.708 | |
| Centre of buoyancy aft of the midship section | 1.5 % of | 1.49 % of |
| 406.7 ft (123.96 m) | 123.98 m | |
| Wetted surface | 27,280 ft² (2534 m²) | 2542 m² |
Think about it. The surface gives a displacement volume 0.37 % below Todd’s. Three things could contribute: the numerical integration, the offsets of the table, and the way the surface is drawn between the offsets. Which test would show how much each contributes?
The largest differences, in and in the displacement volume, lie at the turn of the bilge, where the table has only three heights up to a quarter of the draught. Todd gives the bilge radius through his coefficient = 0.229, that is, = 2.35 m. A circular bilge of that radius, tangent to the flat of keel that the table gives, has = 0.977, Todd’s value, but passes through 0.887 of the half-breadth at 0.075 times the draught, where the table gives 0.866. The table and the coefficients printed beside it are therefore slightly inconsistent, and the surface reproduces the table. The bilge explains only part of the difference in volume. If the maximum half-breadth of the 0.075 waterline in Todd’s table, 0.866, is replaced by the circle’s 0.887, the surface gives = 0.977 and = 7727.0 m³. Nearly all of the difference in disappears, but only about two-thirds of the 28 m³ difference in volume. Refining the integration grid changes the volume by less than 0.01 m³, and the mesh of 61,432 triangles, integrated independently, agrees to 0.04 %, so the remaining 10 m³ is not an error of the integration. It is consistent with the way the surface is drawn between the offsets, which a table of offsets does not fix, and with the precision of the printed table and particulars.
Exercises
Under each exercise, “Show answers” opens its short answers and “Show full solution” its worked solution. Exercises 1.1 to 1.3 are adapted from Attwood4 (public domain); use = 1025 kg/m³.
1.1 The steamship Orient was 135.636 m long and 14.021 m broad, with a mean draught of 6.515 m, = 0.919 and = 0.621. Find its displacement mass, the area of its immersed midship section and .
1.2 A vessel 43.891 m long and 6.858 m broad, at a draught of 2.743 m, displaces 339.4 t in sea water, and its immersed midship section is 11.520 m². Find , and .
1.3 Find the displacement mass, the immersed midship-section area and of a vessel 51.206 m long and 7.620 m broad, at a draught of 3.200 m, with = 0.87 and = 0.595.
1.4 Find all five coefficients of form for (a) a prism of isosceles-triangular section, floating apex down with its waterline at the base of the triangle, and (b) a circular cylinder floating with its axis horizontal, along , and in the waterplane.
1.5 The half-breadth of the Wigley hull ( = 100 m, = 10 m, = 6.25 m) is , with and . Working directly from this formula, not from the closed-form coefficients of Eq. (1.18), find the waterline breadth and the five coefficients of the hull floating upright at half its design draught, using the breadth of that waterline as .
1.6 Prove the identities and . Then show that for any hull whose half-breadth is a product, , the coefficients and do not depend on draught when is taken as the waterline breadth. Which of the three reference hulls have such a half-breadth?
1.7 The Wigley hull, 100 m long, 10 m wide and 6.25 m in draught, has = 2777.8 m³, = 666.67 m² and = 41.667 m². It is stretched to = 120 m with and unchanged. Find , , and the coefficients, without integrating.
1.8 A stability booklet (the stability information supplied to the master of a ship, treated in Chapter 11) gives “LCF = 3.10 m forward of midships” for a ship of = 98 m, and a trim of 0.45 m by the head. Express both as and .
1.9 The table gives offsets (half-breadths, m) of a Wigley hull with = 80 m, = 12 m and = 5 m. One entry has been mistyped.
| Station | (m) | = 0 | = 1.25 m | = 2.5 m | = 3.75 m | = 5 m |
|---|---|---|---|---|---|---|
| 0 | 0 | 0 | 0 | 0 | 0 | 0 |
| 1 | 8 | 0 | 0.945 | 1.620 | 2.025 | 2.160 |
| 2 | 16 | 0 | 1.680 | 2.880 | 3.600 | 3.840 |
| 3 | 24 | 0 | 2.205 | 3.780 | 4.725 | 5.040 |
| 4 | 32 | 0 | 2.520 | 4.320 | 5.400 | 5.760 |
| 5 | 40 | 0 | 2.625 | 4.500 | 5.625 | 6.000 |
| 6 | 48 | 0 | 2.520 | 4.320 | 5.400 | 5.760 |
| 7 | 56 | 0 | 2.205 | 3.870 | 4.725 | 5.040 |
| 8 | 64 | 0 | 1.680 | 2.880 | 3.600 | 3.840 |
| 9 | 72 | 0 | 0.945 | 1.620 | 2.025 | 2.160 |
| 10 | 80 | 0 | 0 | 0 | 0 | 0 |
(a) Find the error in two independent ways: from the symmetry of the hull, and from the fairness of the station through it. (b) Check two other entries against the half-breadth formula of the Wigley hull, Eq. (1.5), scaled to these dimensions. (c) Estimate from the station 5 offsets with the trapezoidal rule, and compare it with the exact value.
1.10 The Wigley hull ( = 100 m, = 10 m, = 6.25 m, with vertical sides above the DWL) is trimmed by the stern with = 7.25 m and = 5.25 m (Fig. 1.26). (a) Find the immersed area of each of stations 0 to 10 up to this waterline, and integrate them along the ship with the trapezoidal rule. Compare the result with the exact volume at this waterline and with the even-keel volume, and explain why the last two are almost equal (the centre of flotation F of the Wigley waterplane lies amidships). (b) Find the moment of each station area about the baseline, and from the areas and moments the longitudinal and vertical centres of buoyancy of the trimmed volume, again with the trapezoidal rule. Compare them with the even-keel centre, = 50 m and = 3.9063 m.
1.11 A steel cargo ship has a moulded displacement volume of 9500 m³. Allowing 0.75 % for the shell plating and 0.20 % for the appendages, find its displacement mass in sea water.
1.12 Find the Froude numbers of a 6 m speedboat and a 120 m ferry, both at 20 knots (10.29 m/s), a 5 m rowing boat at 3 knots (1.543 m/s), and Attwood’s ship, 121.92 m long, at 13½ knots (6.945 m/s). Which of them share a regime of wave-making?
1.13 A ship of = 150 m has = 0.70 and = 0.62. Find the run, entrance and parallel middle body of its design trapezium, and its overall . Would you expect the finished hull’s parallel middle body to be longer or shorter than the trapezium’s?
1.14 The lines plan of the Wigley hull ( = 100 m, = 10 m, = 6.25 m) is to be drawn from its table of offsets, Table 1.2. (a) The 3 m buttock crosses station 4 at 2.423 m. Find that height again from the half-breadths of station 4, 2.1000 m at = 1.5625 m and 3.6000 m at = 3.125 m, by linear interpolation between the waterlines, and explain the difference. (b) Use the half-breadth formula of the hull to find where the waterline at = 3.125 m crosses the 3 m buttock aft of amidships. In the profile, a straight line between the heights of the 3 m buttock at stations 2 and 3, 4.688 m and 2.909 m, passes that position at what height? What does the difference mean for the drawing? (c) Where does the 3 m buttock meet the DWL, and what does it do above it?
1.15 Estimate the wetted surface of a ship with = 121.92 m, = 5.18 m and = 5052 m³ by Denny’s and by Taylor’s approximation, and find the wetted-surface coefficient that Denny’s value implies. What wetted surface would the ship have with the of the Series 60 hull, 2.622?
1.16 The Series 60 hull ( = 121.92 m, = 16.256 m, = 6.502 m, = 7709.1 m³, = 102.97 m², = 1403.3 m², with its full half-breadth, 8.128 m, on the design waterline amidships) is cut amidships, and a parallel middle body 12 m long, with the midship section, is inserted. Find , , , and of the lengthened hull, and compare them with those of the hull stretched to 133.92 m.
1.17 The half-breadth , with , and positive exponents and , describes a family of mathematical hulls that includes the Wigley hull (). (a) Show that, with the breadth of the design waterline, , and . (b) Choose and to give the and of the Series 60 hull, 0.614 and 0.974, and compare the resulting with the Series 60 value, 0.708. What does the comparison show about this family of hulls?
1.18 Figure 1.13 shows the lines of the sailing ship Balclutha, drawn to 3/32 in to 1 ft (1:128): the body plan, enlarged, with its own scales (Fig. 1.13(a)), and the sheer and half-breadth plans with a scale in feet and a scale in metres below them (Fig. 1.13(b)). (a) From which end are the stations numbered, and on which side of the body plan are the after sections drawn? Are the stations equally spaced? (b) With the scale in feet below the half-breadth plan, measure the distance between the perpendiculars, at stations 0 and 20 of the sheer plan, and convert it to metres. The sheet gives this distance as the length of the 1988 floating waterline, 244 ft 11 in; compare. (c) In the body plan the waterlines are 4 ft apart, from 0 ft at the base, and the buttock lines are 2, 4, 8, 12, 16, 18 and 20 ft from the centreline. Read the half-breadth of the widest section on the 16 ft waterline in feet, and find the breadth of the hull there in metres.
Symbols introduced in this chapter
| Symbol | Meaning | Unit |
|---|---|---|
| , | immersed section area at ; up to height (Bonjean) | m² |
| , | immersed area of the midship section; of the largest section | m² |
| , | waterplane area; at height | m² |
| B, F, G, K, Z | centres of buoyancy, flotation, gravity; keel point on the baseline; foot of the perpendicular from G to the line of action of the buoyancy | – |
| , , | moulded breadth; largest breadth on the waterline; at the largest section | m |
| coefficients of form | – | |
| , | prismatic coefficients of the after and forward halves | – |
| , | prismatic coefficients of the entrance and the run over their own lengths | – |
| wetted-surface coefficient | – | |
| , , | volumetric coefficients and ; slenderness ratio | – |
| moulded depth | m | |
| , | flexural rigidity and bending moment of a batten | N·m²; N·m |
| freeboard | m | |
| Froude number | – | |
| GZ | righting lever | m |
| spacing of equally spaced offsets or other ordinates | m | |
| , , | station number, from 0 at the AP; in a source that numbers from the FP; number of station intervals | – |
| KB | height of B above the baseline, | m |
| , , , , | reference length; length between perpendiculars; on the waterline; overall; overall submerged | m |
| , | lengths of the entrance and the run | m |
| lcb | position of B forward of , per cent of (waterline length) | % |
| half-girth of the section at | m | |
| moment about the baseline of the section area up to height | m³ | |
| righting moment | N·m (kN·m) | |
| , | frame number; frame spacing | –; m |
| , | exponents of the waterlines and the sections of a family of mathematical hulls | – |
| degree of a Bézier curve or a B-spline | – | |
| , | point of a parametric curve; control points (position vectors) | m |
| parameter of a parametric curve | – | |
| bilge radius | m | |
| , , | factors by which a hull is stretched along , and | – |
| wetted surface | m² | |
| , , , | moulded draught; at the AP; at the FP; amidships | m |
| , | trim ; trim angle | m; rad |
| ship speed | m/s | |
| weight of the ship | N (kN, MN) | |
| coordinates: forward from the AP, to port, up from the baseline | m | |
| coordinates in axes fixed in space | m | |
| , , | longitudinal centres of buoyancy, flotation, gravity | m |
| half-breadth of the waterline | m | |
| offsets or other ordinates at equal spacing | m | |
| , | height of the waterline; at station when the ship trims | m |
| waterline angle, | rad | |
| deadrise angle | rad (or °) | |
| displacement volume | m³ | |
| , | displacement (force) ; displacement mass | N (kN, MN); t |
| , | density of water; acceleration due to gravity | kg/m³; m/s² |
| angle of heel | rad (or °) | |
| non-dimensional coordinates of the Wigley hull; draught ratio | – | |
| height, as the variable of integration in Eq. (1.23) | m | |
| model scale ratio | – |
Corrections
Corrections to version 1.0, released on 3 November 2026, with their dates.
- 3 November 2026. Sec. 1.2.6 and the reference list cite SOLAS in its consolidated edition of 2024, in place of that of 2020.
- 3 November 2026. The caption of Fig. 1.22 says that the coefficients of form are rounded to three decimals, so that can differ from in the last digit.
- 5 November 2026. Sec. 1.4, Example 1.5, Sec. 1.8.2 and Table 1.4 give the length on the waterline of the Series 60 hull as 123.98 m, the sum of the length between perpendiculars, 121.92 m, and the 2.06 m by which the cruiser stern carries the waterline aft of the AP, in place of 123.97 m, which was measured on the grid of the integration. The values based on it are unchanged to the figures printed.
- 5 November 2026. Sec. 1.8.2 says that the trapezium’s run on the waterline basis, 47.2 m, comes from the prismatic coefficient of the after half of the waterline length, 0.619.
- 5 November 2026. Sec. 1.1.2 says that the height of the metacentre above B depends on the waterplane and on the volume displaced, Sec. 1.6 names Exercise 1.10 as a first evaluation of its integrals, and Secs. 1.4 and 1.5.6 say what a cruiser stern is and where a mesh is described.
- 6 November 2026. Sec. 1.1 is headed “Requirements of a floating ship”, in place of “What a floating ship must do”, and Sec. 1.1.5 “Organization of the book”, in place of “How the book is organized”; in the Notes on the data, “Agreement of the surface with Todd’s hull” replaces “How closely the surface matches Todd’s hull”. The text of these sections is unchanged.
References
- Vasamuseet. (n.d.-a). The disaster. Retrieved October 6, 2026, from https://www.vasamuseet.se/en/explore/vasa-history/disaster Cited: ↑
- Vasamuseet. (n.d.-b). The inquest. Retrieved October 6, 2026, from https://www.vasamuseet.se/en/explore/vasa-history/inquest Cited: ↑
- Fuller, H. J. (2025). “The whole history of this ill-fated vessel”: HMS Captain, the American Civil War, and the mid-Victorian struggle for naval superiority. International Journal of Naval History, 18(1). https://ijnh.seahistory.org/the-whole-history-of-this-ill-fated-vessel-hms-captain-the-american-civil-war-and-the-mid-victorian-struggle-for-naval-superiority/ Cited: ↑ · ↑ · ↑ · ↑
- Attwood, E. L. (1899). Text-book of theoretical naval architecture. Longmans, Green, and Co. (Public domain.) Cited: ↑ pp. 160–162 · ↑ ch. I, p. 30 · ↑ ch. I, Example 39 · ↑ ch. II, pp. 81–82 · ↑ ch. II, pp. 80–81 · ↑ ch. I, Examples 40–42
- Nowacki, H., & Ferreiro, L. D. (2003). Historical roots of the theory of hydrostatic stability of ships. In Proceedings of the 8th International Conference on the Stability of Ships and Ocean Vehicles (STAB 2003) (pp. 1–30). Escuela Técnica Superior de Ingenieros Navales. https://shipstab.org/files/Proceedings/STAB/STAB2003/Papers/Paper%2001.pdf Cited: ↑ · ↑ · ↑
- Nowacki, H., & Ferreiro, L. D. (2011). Historical roots of the theory of hydrostatic stability of ships. In M. A. S. Neves, V. L. Belenky, J. O. de Kat, K. Spyrou, & N. Umeda (Eds.), Contemporary ideas on ship stability and capsizing in waves (pp. 141–180). Springer. https://doi.org/10.1007/978-94-007-1482-3_8 Cited: ↑ · ↑
- Biran, A., & López-Pulido, R. (2014). Ship hydrostatics and stability (2nd ed.). Butterworth-Heinemann. Cited: ↑ p. 7 · ↑ p. 7 · ↑ Section 1.4.1 · ↑ p. 8 · ↑ p. 8 · ↑ Section 4.3 · ↑ · ↑ Section 1.4.1 · ↑ Section 1.4.1 · ↑ p. 10 · ↑ Section 1.4.1 · ↑ p. 8 · ↑ p. 8 · ↑ Section 13.3.1 · ↑ pp. 11–12 · ↑ Section 1.4.2 · ↑ ch. 1 · ↑ Section 13.2 · ↑ Section 13.2.4 · ↑ Section 13.2.4 · ↑ Section 13.2.5 · ↑ Section 13.2.5 · ↑ Section 4.6 · ↑ p. 114 · ↑ Section 4.4 · ↑ Section 4.4 · ↑ eqs 4.16–4.17
- Hamlin, N. A. (1988). Ship geometry. In E. V. Lewis (Ed.), Principles of naval architecture: Vol. I. Stability and strength (2nd rev., ch. I). Society of Naval Architects and Marine Engineers. Cited: ↑ p. 5 · ↑ Section 1 · ↑ Section 1 · ↑ Section 1 · ↑ Section 1 · ↑ p. 6 · ↑ p. 6 · ↑ p. 6 · ↑ p. 10 · ↑ Section 1 · ↑ Section 1 · ↑ Section 5 · ↑ · ↑ Section 1 · ↑ p. 6 · ↑ Section 1 · ↑ p. 5 · ↑ p. 14 · ↑ Section 1 · ↑ p. 4 · ↑ p. 1 · ↑ p. 1 · ↑ p. 7 · ↑ p. 7 · ↑ p. 2 · ↑ p. 4 · ↑ p. 4 · ↑ p. 4 · ↑ p. 4 · ↑ pp. 4–5 · ↑ Section 1 · ↑ pp. 7–8 · ↑ Section 1 · ↑ pp. 6, 10–11 · ↑ p. 10 · ↑ p. 11 · ↑ p. 8 · ↑ Section 1 · ↑ pp. 14–15 · ↑ p. 15 · ↑ p. 15 · ↑ p. 10 · ↑ Section 3 · ↑ Section 3 · ↑ Section 3 · ↑ Section 3 · ↑ Section 3 · ↑ Section 3 · ↑ Section 3, Table 2 · ↑ Section 3 · ↑ Section 3 · ↑ Section 3 · ↑ p. 21 · ↑ Section 3, Table 2 · ↑ p. 10 · ↑ p. 10 · ↑ Section 3, Table 2 · ↑ Section 3, Table 2 · ↑ Section 7 · ↑ Section 7 · ↑ Section 7 · ↑ Section 7 · ↑ Section 7 · ↑ Section 7 · ↑ Section 7 · ↑ Section 7, Fig. 38 · ↑ p. 19 · ↑ p. 6 · ↑ p. 14 · ↑ p. 2 · ↑ p. 2 · ↑ Section 6 · ↑ Section 6 · ↑ Section 6
- ITTC. (2024a). ITTC dictionary of hydromechanics (Version 2024). International Towing Tank Conference. Cited: ↑ s.v. "even keel" · ↑ s.v. "perpendiculars", "rudder post" and "rudder stock" · ↑ s.v. "body" · ↑ s.v. "breadth" · ↑ s.v. "freeboard" · ↑ s.v. "deadrise angle" · ↑ s.v. "floor, rise of" · ↑ s.v. "bulb" and "stern" · ↑ s.v. "moulded" · ↑ s.v. "breadth" · ↑ s.v. "displacement volume, molded" · ↑ s.v. "axes co-ordinates" · ↑ s.v. "heel or list" · ↑ s.v. "trim" · ↑ s.v. "station" · ↑ s.v. "chine" and "knuckle" · ↑ s.v. "water, standard salt" and "water, standard fresh" · ↑ s.v. "waterplane area coefficient" and "prismatic coefficient" · ↑ s.v. "section, ship shape" · ↑ s.v. "stem", "stern" and "bulb" · ↑ s.v. "girth" · ↑ s.v. "surface, wetted" · ↑ s.v. "prismatic coefficient" · ↑ s.v. "sectional area curve"
- IMO. (2020). International Code on Intact Stability, 2008 (2020 ed.). International Maritime Organization. (IS Code; adopted by Resolution MSC.267(85).) Cited: ↑ Introduction, para. 2.12 · ↑ Introduction, para. 2.13 · ↑ Introduction, para. 2.14 · ↑ Introduction, para. 2.13
- ITTC. (2024b). ITTC symbols and terminology list (Version 2024). International Towing Tank Conference. Cited: ↑ · ↑ · ↑ · ↑ · ↑ · ↑
- Tupper, E. C. (2013). Introduction to naval architecture (5th ed.). Butterworth-Heinemann. Cited: ↑ p. 13 · ↑ p. 13 · ↑ p. 12 · ↑ ch. 2 · ↑ p. 14 · ↑ p. 14 · ↑ ch. 2 · ↑ ch. 2 · ↑ Table 2.1 · ↑ p. 16 · ↑ p. 16 · ↑ p. 16
- Moore, C. S. (2010). Intact stability (J. R. Paulling, Ed.; Principles of Naval Architecture Series). Society of Naval Architects and Marine Engineers. Cited: ↑ Section 8 · ↑ pp. 58–59 · ↑ Section 14
- IMO. (2024). SOLAS: Consolidated edition 2024 (Sales No. IH110E). International Maritime Organization. Cited: ↑ regulation II-1/5.6
- NOAA National Ocean Service. (n.d.). Why do ships use “port” and “starboard” instead of “left” and “right”? Retrieved October 6, 2026, from https://oceanservice.noaa.gov/facts/port-starboard.html Cited: ↑
- Barrass, C. B., & Derrett, D. R. (2006). Ship stability for masters and mates (6th ed.). Butterworth-Heinemann. Cited: ↑ p. 157 · ↑ · ↑ p. 66 · ↑ ch. 9
- Wigley, W. C. S. (1934). A comparison of experiment and calculated wave-profiles and wave-resistances for a form having parabolic waterlines. Proceedings of the Royal Society of London. Series A, 144(851), 144–159. https://doi.org/10.1098/rspa.1934.0039 Cited: ↑
- Kajitani, H., Miyata, H., Ikehata, M., Tanaka, H., Adachi, H., Namimatsu, M., & Ogiwara, S. (1983). The summary of the cooperative experiment on Wigley parabolic model in Japan. In Proceedings of the Second DTNSRDC Workshop on Ship Wave-Resistance Computations. David W. Taylor Naval Ship Research and Development Center. https://archive.org/details/DTIC_ADP003037 Cited: ↑
- Journée, J. M. J. (1992). Experiments and calculations on four Wigley hullforms (Report No. 909). Ship Hydromechanics Laboratory, Delft University of Technology. https://repository.tudelft.nl/islandora/object/uuid:52a76d0b-5db1-4902-a254-a81491b9cf99 Cited: ↑
- Todd, F. H. (1963). Series 60: Methodical experiments with models of single-screw merchant ships (Report No. 1712). David Taylor Model Basin. https://apps.dtic.mil/sti/pdfs/AD0419990.pdf (also https://archive.org/details/methodicalexperi00todd) Cited: ↑ · ↑ · ↑ Figure 12, p. V-2 · ↑ Figure 11, p. IV-25 · ↑ Figure 12, p. V-2 · ↑ · ↑ Table 3 · ↑ · ↑ Table 3 · ↑ Table 2 · ↑
- Biran, A. (2019). Geometry for naval architects. Butterworth-Heinemann. Cited: ↑ p. 88 · ↑ pp. 4–5 · ↑ ch. 2 · ↑ ch. 2 · ↑ ch. 2 · ↑ p. 97 · ↑ ch. 2 · ↑ ch. 2 · ↑ ch. 2 · ↑ ch. 3, quoting Watson
- Historic American Engineering Record. (1990). Ship “Balclutha” (1886), San Francisco Maritime National Historical Park, San Francisco, San Francisco County, California (HAER CA-54), sheet 3 of 69: Lines: Body plan, sheer plan, half-breadth plan [Measured drawing; Robbyn L. Jackson, delineator]. Library of Congress, Prints and Photographs Division. https://www.loc.gov/item/ca1493/ (Public domain.) Cited: ↑ notes 1 and 3 · ↑ notes 3 and 7 · ↑ note 5 · ↑ note 6 · ↑ note 9 · ↑
- Letcher, J. S., Jr. (2009). The geometry of ships (J. R. Paulling, Ed.; Principles of Naval Architecture Series). Society of Naval Architects and Marine Engineers. Cited: ↑ p. 34 · ↑ p. 36 · ↑ p. 36 · ↑ p. 36 · ↑ pp. 11, 13 · ↑ p. 14 · ↑ p. 14
- ITTC. (2024c). Fresh water and seawater properties (Recommended Procedures and Guidelines 7.5-02-01-03, Rev. 03). International Towing Tank Conference. https://www.ittc.info/media/11764/75-02-01-03.pdf Cited: ↑
- Kemp, J. F., & Young, P. (2001). Ship stability: Notes and examples (3rd ed., rev. C. B. Barrass). Butterworth-Heinemann. Cited: ↑ p. 6 · ↑ p. xv
- MAN Energy Solutions. (2018). Basic principles of ship propulsion (Publication 5510-0004-04). https://man-es.com/docs/default-source/marine/5510-0004-04_18-1021-basic-principles-of-ship-propulsion_web.pdf Cited: ↑ Table 1.01
- van Dokkum, K. (2003). Ship knowledge: A modern encyclopedia. Dokmar. Cited: ↑ p. 26 · ↑ pp. 26–27
- Holtrop, J., & Mennen, G. G. J. (1982). An approximate power prediction method. International Shipbuilding Progress, 29(335), 166–170. https://doi.org/10.3233/ISP-1982-2933501 Cited: ↑
- Orca3D. (n.d.). Hull design & fairing. Orca3D, LLC. Retrieved October 7, 2026, from https://orca3d.com/pages/hull-design-fairing Cited: ↑
- Bentley Systems. (n.d.). MAXSURF: Marine vessel design software. Retrieved October 7, 2026, from https://www.bentley.com/software/maxsurf/ Cited: ↑
- FREE!ship [Computer software]. (n.d.). SourceForge. Retrieved October 7, 2026, from https://sourceforge.net/projects/freeship/ (GPL-2.0; last updated January 31, 2016.) Cited: ↑
- Robert McNeel & Associates. (n.d.-a). CurvatureGraph (Rhino 8 help). Retrieved October 7, 2026, from https://docs.mcneel.com/rhino/8/help/en-us/commands/curvaturegraph.htm Cited: ↑
- Robert McNeel & Associates. (n.d.-b). Zebra (Rhino 8 help). Retrieved October 7, 2026, from https://docs.mcneel.com/rhino/8/help/en-us/commands/zebra.htm Cited: ↑
- FRIENDSHIP SYSTEMS. (n.d.). Basic ship hull [CAESES sample]. Retrieved October 7, 2026, from https://docs.caeses.com/samples/maritime/basic-shiphull/ Cited: ↑
- Han, S., Lee, Y.-S., & Choi, Y. B. (2012). Hydrodynamic hull form optimization using parametric models. Journal of Marine Science and Technology, 17(1), 1–17. https://doi.org/10.1007/s00773-011-0148-8 Cited: ↑
- ISO. (2003). Industrial automation systems and integration — Product data representation and exchange — Part 216: Application protocol: Ship moulded forms (ISO 10303-216:2003; last reviewed and confirmed 2025). International Organization for Standardization. https://www.iso.org/standard/25078.html Cited: ↑
- Koelman, H. J., Veelo, B. N., Seppälä, L., & Filius, P. (2024). Closing the gap between early and detailed ship design models. In Proceedings of the International Marine Design Conference 2024. TU Delft OPEN Publishing. https://doi.org/10.59490/imdc.2024.837 Cited: ↑
- CFD Direct. (n.d.). Mesh generation with snappyHexMesh (OpenFOAM v14 user guide, Section 5.5). Retrieved November 2, 2026, from https://doc.cfd.direct/openfoam/user-guide-v14/snappyhexmesh Cited: ↑
- Lovas, T., Somogyi, Á. J., & Simongáti, G. (2022). Laser scanning ship hulls to support hydrodynamic simulations. Periodica Polytechnica Civil Engineering, 66(1), 291–297. https://doi.org/10.3311/PPci.19353 Cited: ↑
- Larson, T. (2024, January 16). 3D measurement and scanning: What is it and why should ship owners care? Wärtsilä. https://www.wartsila.com/insights/article/3d-measurement-and-scanning-what-is-it-and-why-should-ship-owners-care Cited: ↑
- SIMMAN 2014. (n.d.-a). Geometry and conditions [MOERI container ship (KCS)]. FORCE Technology. Retrieved October 7, 2026, from http://www.simman2014.dk/ship-data/moeri-container-ship/geometry-and-conditions-moeri-container-ship/ Cited: ↑
- SIMMAN 2014. (n.d.-b). Geometry and conditions [MOERI KVLCC2 tanker]. FORCE Technology. Retrieved October 7, 2026, from http://www.simman2014.dk/ship-data/moeri-kvlcc2-tanker/geometry-and-conditions-moeri-kvlcc2-tanker/ Cited: ↑
- National Maritime Research Institute. (n.d.). T2015: JBC [Japan Bulk Carrier; Tokyo 2015 workshop on CFD in ship hydrodynamics]. Retrieved October 7, 2026, from https://t2015.nmri.go.jp/jbc.html Cited: ↑