
Simon Stevin (1548–1620) is credited with the statement that the centre of gravity and the centre of buoyancy must lie on one vertical15. Archimedes had already reasoned with the moments of the weight and the buoyancy in his analysis of a floating paraboloid, and Stevin restated the condition17. He also concluded, wrongly, that for stability B must always lie above G17.
Figures and tables have more room in landscape.
Chapter 3: Weight, buoyancy and flotation
Version 1.0 · last revised 6 November 2026 · corrections
Prologue: Plimsoll’s line
In 1873 Samuel Plimsoll, the Liberal member of Parliament for Derby, published Our Seamen: An Appeal, a book about the loss of British merchant ships and of the men who sailed in them. Quoting the Board of Trade, he counted 1,927 vessels lost or damaged in 1871 on and near the coasts of the United Kingdom1. He then listed what he called the sources of disaster: undermanning, bad stowage, deck-loading, deficient engine power, over-insurance, defective construction, improper lengthening, overloading and want of repair1. Several of them worked together; the loss of an old ship insured for more than its value, for example, cost the owner nothing, and such a ship, Plimsoll wrote, might be loaded “until her main-deck is within two feet of the water”1, a freeboard of 0.61 m. Ships overloaded and in poor repair came to be called coffin ships2.
Against overloading, Plimsoll cited an old rule of the trade, three inches of freeboard for every foot of depth of hold, and he reported that shipowners had asked the Board of Trade to require a maximum load line on the side of every ship, a mark showing the deepest waterline to which it might be loaded1. Lloyd’s Register had published the rule in 1835, as a voluntary rule3.
Parliament did not act at once. In March 1873 a Royal Commission on Unseaworthy Ships was appointed, chaired by the Duke of Somerset4. Its preliminary report accepted that overloading made a ship unseaworthy but declined to recommend a fixed load line, which most of its witnesses opposed5. On 24 June 1874 the Commons were told that the final report had been signed “that very day”, and in that sitting Plimsoll’s Merchant Shipping Survey Bill was lost on its second reading6 by 173 votes to 170. In that debate he told the House6 that 3,554 seamen had been lost in the previous year, against an average of 2,700.
On 22 July 1875 the Prime Minister, Benjamin Disraeli, announced that the Government’s own Merchant Shipping Bill would be dropped for the session7. Plimsoll rose to beg him not to consign “some thousands of living human beings to undeserved and miserable death”. He declared himself determined to unmask “the villains who send to death and destruction”, named three ships lost in 1874 with 87 lives and gave notice that he would ask whether their registered owner, Edward Bates, was the member for Plymouth. Called to order, he refused to withdraw the word, and Disraeli moved that he be reprimanded by the Speaker8. A week later Plimsoll apologized for language that had broken the usage of the House, adding that he did not withdraw “any statement of fact”, and the order for the reprimand was discharged9. By then the Government had promised a short measure to stop unseaworthy ships from going to sea10, and on 13 August 1875 the Merchant Shipping Act 1875 became law.
Section 6 of that Act made the load line a statutory mark for the first time. From 1 November 1875 the owner was to mark on each side of the ship amidships a disc 12 inches (305 mm) in diameter with a horizontal line 18 inches (457 mm) long through its centre. The centre of the disc was to indicate the maximum load line in salt water, and the owner was to state in writing its distance below the deck lines, lines marked on the side at the level of each deck above the water11. The Merchant Shipping Act 1876 made the requirement permanent: the owner marked the disc before each voyage outwards from a port in the United Kingdom and stated its distance below the deck line, and the owners of coasting ships gave the distance in an annual statement12. The owner, however, decided where the disc went, and its position was approved by the Board of Trade only from 1890 (Fig. 3.1). It then followed freeboard tables drawn up in 1885 by a Load Line Committee from those of Lloyd’s Register; in them the freeboard of a flush-decked ship, whose upper deck runs unbroken from end to end, was based on reserve buoyancy13. Under the Merchant Shipping Act 1894, the assignment of the freeboard was delegated to Lloyd’s Register, to another approved society or to an officer of the Board of Trade14.
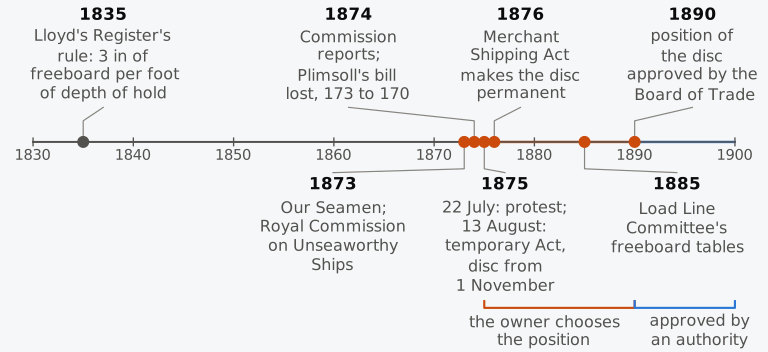
Figure 3.1 The load line in Britain, from Lloyd’s Register’s rule of 1835 to the approval of the position of the disc by the Board of Trade in 1890.
How many lives the mark saved is not known with any precision, since the figures quoted at the time, such as Plimsoll’s, counted different things; what the mark does to a ship is easier to state. It limits how deep a ship may float, and because a ship sinks until it displaces its own weight of water, a limit on draught is a limit on weight and, once the weight of the empty ship is known, a limit on what it may carry. The disc of 1875 marked the deepest waterline in salt water, and in fresh water a ship of given weight sinks deeper, so the meaning of the mark also depends on the density of the water. The height of the disc below the deck fixes how much watertight hull is left above the water, the reserve buoyancy on which the tables of 1885 were based. These three ideas rest on the two conditions of equilibrium, that buoyancy equals weight and that the centre of gravity G and the centre of buoyancy B lie on one vertical, and on the volumes and centres of the hull. We return to the mark, and to the conventions that later made it international, in Sec. 3.7, once these are in place.
In this chapter
By the end of this chapter you will be able to:
- show that the pressure of the water gives a buoyancy through B, and state the conditions of equilibrium;
- find the displacement mass and centre of gravity of a loading condition;
- find the draught from the displacement curve, or from the tonnes per centimetre immersion for a small mass;
- find the displacement from the draughts, allowing for hog or sag and for the water’s density;
- compute the fresh water and dock water allowances, and relate the load line mark to reserve buoyancy.
What it assumes. You need the volume, waterplane area and centre of buoyancy at any draught (Chapter 2), and the volume curve of Sec. 2.8.1.
A first reading. Sections 3.1 to 3.7 carry the main thread. The draught survey of Sec. 3.6.2 and the rules for assigning the summer freeboard in Sec. 3.7.3 belong to commercial and regulatory practice and can wait for a second reading.
3.1 Principles of flotation
With the hull described in Chapter 1 and integrated in Chapter 2, you can now find the volume below any waterline and the centroid of that volume. The water presses on the surface that bounds the volume, and the force that results is the reason a steel ship, which weighs thousands of tonnes, floats while a steel bolt sinks. The pressure determines both the size of the buoyant force and the line on which it acts.
3.1.1 Pressure on the hull
Water at rest exerts on any surface a pressure that acts normal to the surface and increases with depth. Measured above the pressure of the atmosphere, which acts on every side of the ship and so contributes no net force15, the pressure at height in water of density whose free surface is at height is
For a ship upright and at even keel, . On an element of the wetted surface, whose unit normal points out of the hull into the water, the water pushes inwards with the force , and the total force of the water on the hull is
the integral being taken over the wetted surface (Fig. 3.2).
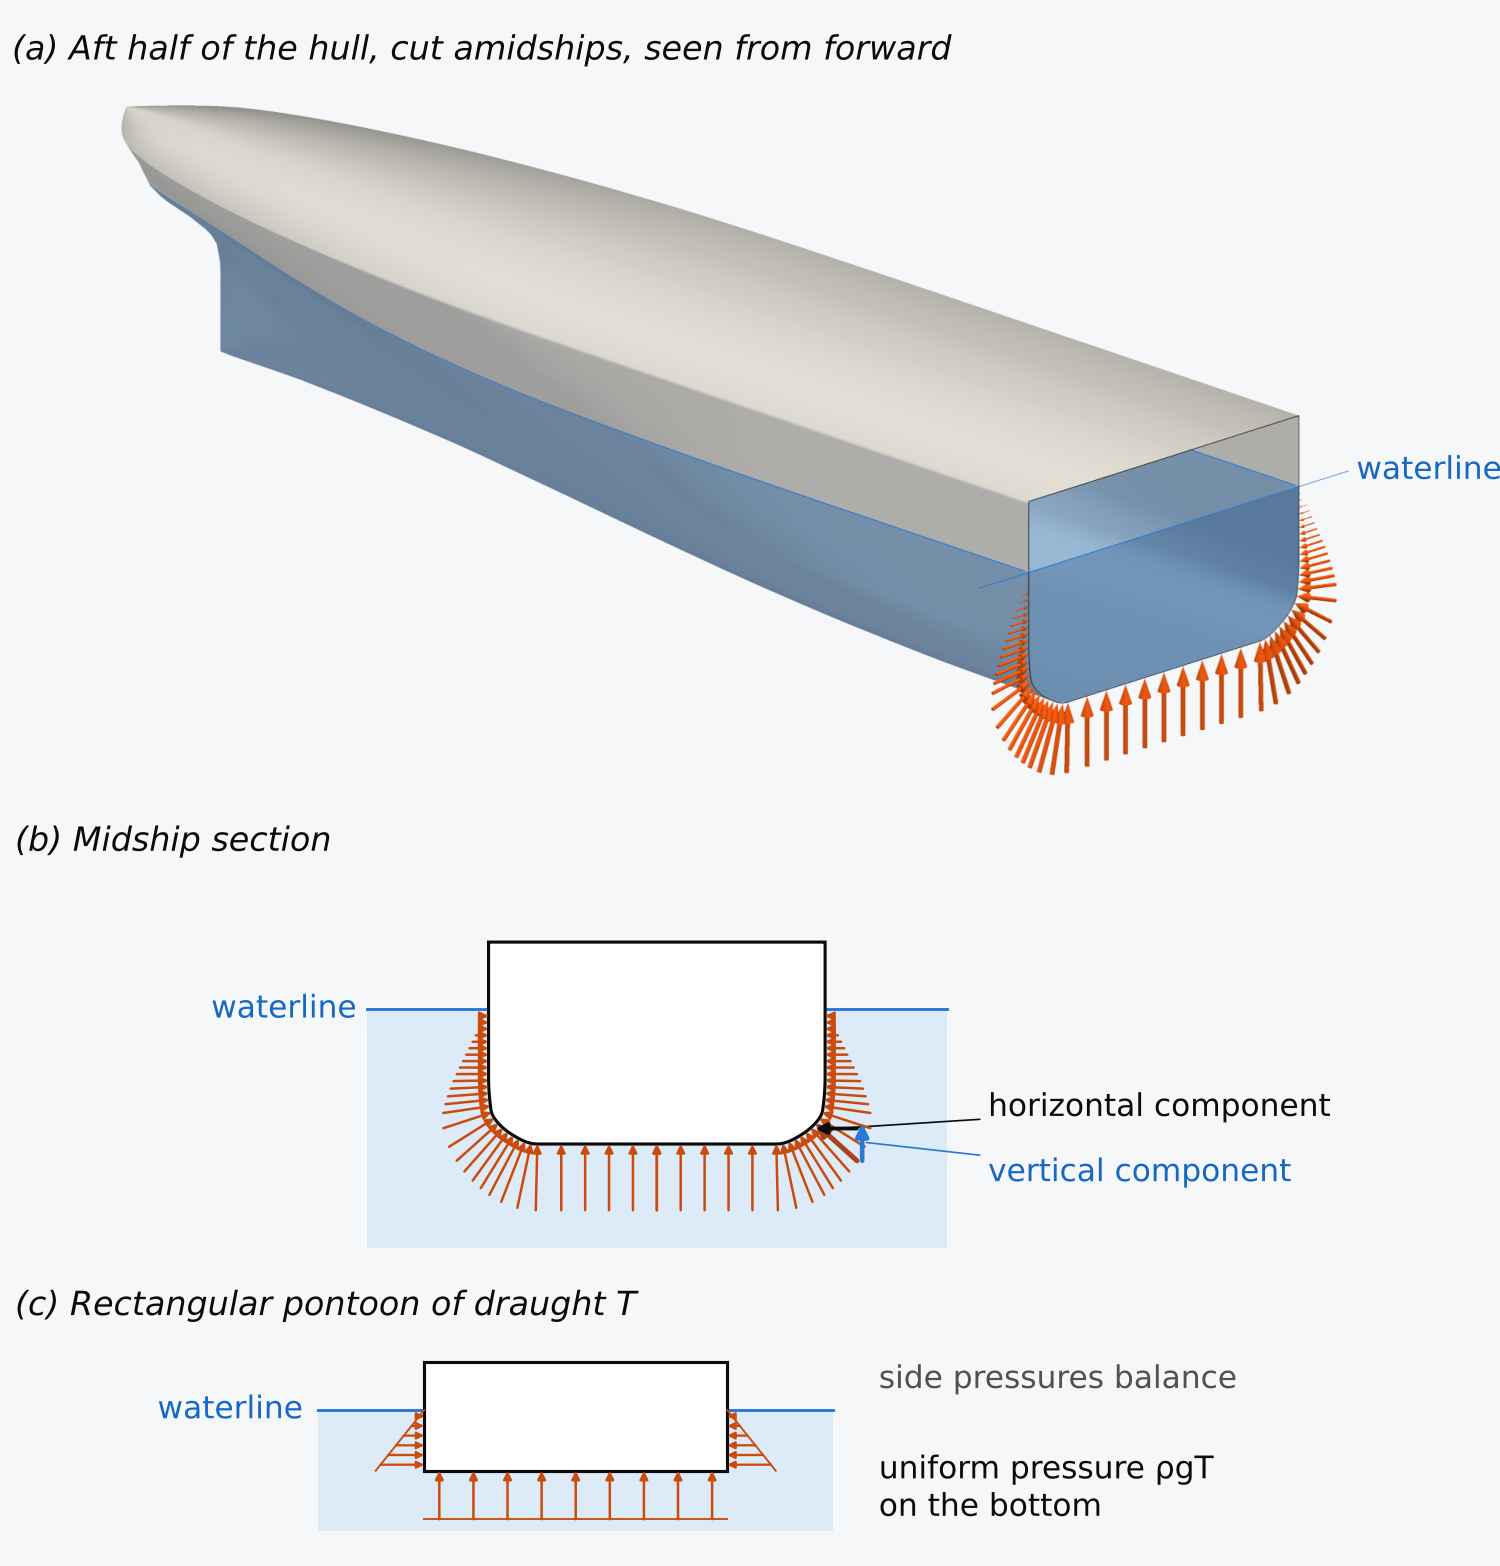
Figure 3.2 The water’s pressure on a floating hull: (a) the aft half of the Series 60 hull, cut amidships; (b) its midship section; (c) a rectangular pontoon. Arrow lengths are proportional to the pressure.
The integral is evaluated by closing the wetted surface with the waterplane. On the waterplane , so adding it changes nothing, and the closed surface surrounds the immersed volume . For a closed surface the divergence theorem turns the integral of into an integral over the enclosed volume of the gradient of , which by Eq. (3.1) is , with the unit vector upwards, so that
The horizontal components of the pressure cancel, and the vertical components add up to an upward force equal to the weight of the water that would fill the immersed volume. This is the force called the displacement, . Archimedes stated that a solid lighter than the fluid sinks until the weight of the fluid it displaces equals its own weight16, and he proved it without calculation17. His argument, carried one step further, also gives the line along which the force acts.
Imagine the water around the ship solidified at its level, the ship lifted out, the hollow it leaves filled with water up to the level of the sea, and the surrounding water then made liquid again18. The water around the hollow is unchanged, so it presses on the new water as it pressed on the hull. The new water is at rest, so these pressures carry its weight, , which is Archimedes’ result. Their resultant also acts along the vertical through the centre of gravity of the new water, the centroid of the immersed volume, since otherwise the water would begin to turn. These are the pressures that the hull receives, so the buoyancy is a single force, , acting upwards along the vertical through that centroid, the centre of buoyancy B. The divergence theorem, applied to the moment of the pressure forces, gives the line of action by calculation (Exercise 3.17).
The argument, like the integral, requires that the water press on the whole of the immersed surface. A body resting on the bottom with no water under it receives no upward pressure there and is pressed down onto the bottom instead15, which matters to a ship aground or in a dry dock. No other condition on the shape is needed, and the volume integrals of Chapter 2 give the buoyancy of the Series 60 hull.
Example 3.1. Pressure on a pontoon and on a V-shaped float. A rectangular pontoon 40 m long and 10 m wide floats in sea water ( = 1.025 t/m³) at a draught of 2.0 m. Find the pressure on its bottom, the upward force on the bottom and the mass of the pontoon, and the horizontal force on each long side. Then find the buoyancy of a float 40 m long whose section is a V, 10 m wide at the waterline and 2.0 m deep, by adding up the vertical components of the pressure on its two sloping sides.
3.1.2 The two conditions of equilibrium
The weight of the ship and of everything on board acts downwards through the centre of gravity G. If the masses on board are , the weight is , and the ship is in equilibrium when the buoyancy and the weight are equal and act along one line:
The second condition is written for a ship upright and at even keel, with a horizontal waterplane; in general it requires that the line joining G and B be vertical. If it is not, the two equal forces form a couple that tends to heel or trim the ship. A new equilibrium is possible only when the changed immersed shape places B on the vertical through G (Fig. 3.3 and Animation 3.1); whether that equilibrium is stable needs a separate check.
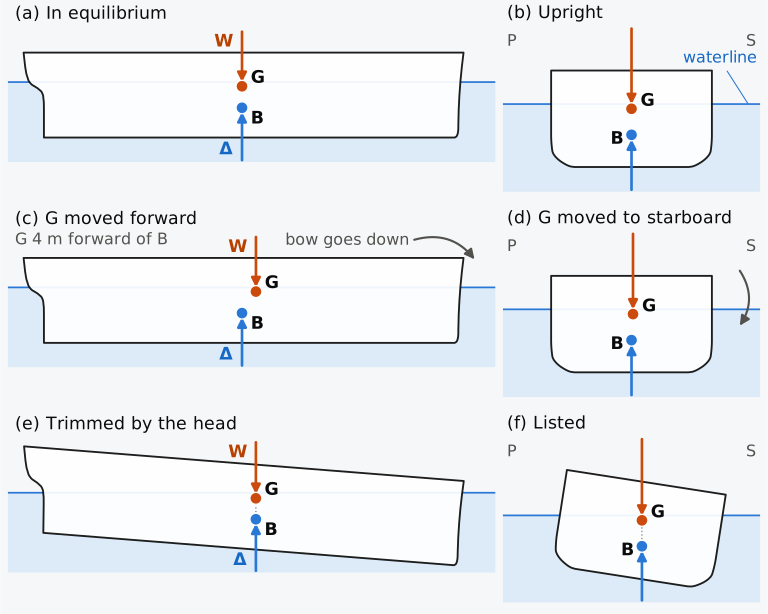
Figure 3.3 Equilibrium of the Series 60 ship in profile and midship section: (a, b) G and B on one vertical; (c, d) G moved 4 m forward or 0.15 m to starboard; (e, f) the new equilibrium, (f) for a long body of the midship section. Profile heights are exaggerated 2.5 times; sections are to scale, seen from aft.
Animation 3.1 A mass moved on deck, and the equilibria the ship passes through. The starting point is a loaded cargo ship on the Series 60 hull, in the departure condition of Example 3.3. The moved masses are notional: they shift G as moving them at constant height would, and the block drawn on deck marks that shift rather than an item of the ship’s load. Above, in profile, with heights drawn 2.5 times as large as lengths, the whole hull: 600 t is moved 50 m forward, which moves G 3.89 m forward, a little less than the 4 m of Fig. 3.3, and the ship trims by the head, to 3.7 m. Below, the midship section treated as a long prismatic body: 150 t is moved 7 m to starboard, which moves G 0.136 m against the 0.15 m of Fig. 3.3, and the section lists, to 8.1°. Throughout, B stays directly below G. Each frame is an equilibrium computed numerically on the stated geometry, so the animation shows where the ship comes to rest, not how it moves on the way or how long it takes. No sound; 12.5 s.
The conditions place no restriction on the heights and , written KG and KB when they are measured from the baseline. In most ships G lies above B, and in the departure condition of Example 3.3 it is 2.5 m above it. Equilibrium with G above B is possible because the conditions concern the forces and their lines of action. Whether the equilibrium is stable, whether the ship returns upright when heeled, depends on how B moves as the ship heels compared with the height of G.
Historical note: Stevin
3.1.3 Flotation of a steel ship
A ship floats because the volume it encloses is large compared with its mass; the density to compare with that of the water is the mean density of the whole watertight envelope, with everything inside it.
Example 3.2. A steel box. A closed box 30 m long, 8 m wide and 3 m deep is made of steel plate 12 mm thick on all six faces, with no stiffening. Taking the density of steel as 7.85 t/m³, find its mass, its draught in sea water and its mean density. How thick could the plate be before the box sank?
A loaded ship is denser than the box but still less dense than the water. The Series 60 hull, loaded to its design waterline, displaces 7902 t of sea water; its watertight volume up to the deck, 12,608 m³, would hold 12,923 t. Its mean density is 0.627 t/m³, and 39 % of its watertight volume is above the water.
3.1.4 Stability in heave
Suppose a ship floating in equilibrium is pushed down by a small sinkage without heeling or trimming. The immersed volume increases by a layer of area and thickness , the buoyancy by , and the weight is unchanged, so a net upward force
acts to push the ship back up (Fig. 3.4). For a watertight hull with a waterplane, at fixed heel and trim, this is a restoring force in heave; its waterplane acts as a spring of stiffness . For the Series 60 hull at its design draught this is kN/m, or 141 kN for each centimetre. A fully submerged body has no waterplane. If neither it nor the water is compressed and the density of the water is uniform, its buoyancy does not change with depth; if its weight equals its buoyancy it is in neutral equilibrium at any depth, and if not, it rises or sinks until it reaches the surface or the bottom15. A submarine must therefore control its depth actively.
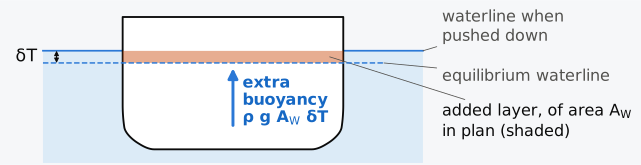
Figure 3.4 The restoring force in heave: the midship section of the Series 60 ship pushed down by , and the extra buoyancy of the layer between the two waterlines. To scale, seen from aft; exaggerated.
3.2 Displacement, lightship and deadweight
The buoyancy side of the first condition of equilibrium is fixed by the hull and the draught; the weight side is the sum of the masses on board, and these are divided into two groups, the empty ship and what it carries. The prologue’s limit on draught becomes a limit on cargo only once the first group is known.
3.2.1 Lightship
The lightship mass , or lightweight, is the mass of the ship complete and ready for service but empty of everything that varies from voyage to voyage. In the International Convention for the Safety of Life at Sea (SOLAS) it is the ship’s displacement with its tanks empty of fuel, lubricating oil, ballast, fresh water and feedwater, and with no cargo, consumable stores, passengers, crew or effects on board19. The liquids in the machinery and piping, at their working levels, belong to the lightship under the International Code on Intact Stability (IS Code)20. So do the media of fixed fire-fighting systems, such as the fresh water or carbon dioxide they hold, under MSC.1/Circ.1539/Rev.1, a unified interpretation of SOLAS21. For estimating and controlling it, the lightship is divided into the hull structure, the outfit and the machinery, each subdivided further; the US Maritime Administration’s classification of merchant ship weights has ten subgroups in each of these three groups22, and navies use systems of their own.
The lightship mass is first estimated during design, then measured on completion of the ship by an inclining experiment and a lightweight survey. In the experiment known masses are moved across the deck and the heel they cause is measured; the survey is an account of every item on board at the time that does not belong to the lightship, from which the condition in which the ship floats is reduced to the lightship. Both are defined in the IS Code20. The lightship mass changes in service as coats of paint build up, cargo residues and sediment collect in holds and tanks, marine growth forms on the shell, spares and other items are left on board and the ship is repaired and altered, while corrosion and wear remove steel23.
3.2.2 Deadweight
The deadweight is everything else: cargo, fuel oil, diesel oil, lubricating oil, fresh water, ballast water, stores and provisions, and the crew, passengers and their effects, so that
The deadweight of a loading condition is the sum of the variable masses in that condition, and it changes during every voyage as fuel and stores are used. The deadweight of a ship, the figure in its particulars, is instead a capacity, which SOLAS defines as the ship’s displacement in sea water of density 1.025 t/m³ when floating at its summer load line, less its lightweight19. The summer load line is the deepest waterline at which the ship may float at sea in a summer zone or season, and it is marked on the ship’s side. A ship described as of 50,000 t deadweight can carry that much in total, of which cargo is the largest part, and the mass of the cargo is the cargo deadweight. With the lightship mass fixed, the limit on draught set by the summer load line becomes a limit on the deadweight, and Chapman found the weight of cargo as the difference between the displacement and the weight of the hull (prologue of Chapter 2).
The ratio of the capacity deadweight to the displacement at the summer load line is the deadweight coefficient,
In the full-load conditions of four merchant ships22, deadweight makes up 68 % of the displacement of a container ship 262 m long between perpendiculars, 72 % of a carrier of liquefied natural gas (LNG) of 275 m, 79 % of a bulk carrier of 160 m and 85 % of a tanker of 239 m. A ship that carries dense cargo in a full, simple hull has a high ; a ship whose own structure and machinery are a large part of its displacement, such as a container ship built for speed, has a lower . The illustrative cargo ship of Example 3.3, built on the Series 60 hull, has = 0.64.
3.2.3 Displacement and tonnage
Ships are also described by their gross tonnage (GT) and net tonnage (NT), which, despite the name, measure volume, not mass. The word tonnage goes back to the tun, a wine cask, and to the charges levied on a ship according to how many it could carry24. The International Convention on Tonnage Measurement of Ships, 1969 (ITC 1969), entered into force on 18 July 1982, and the tonnages of ships are now measured under it25. The gross tonnage is computed from the total moulded volume of all the enclosed spaces of the ship26, as with . The net tonnage is computed from the volume of the cargo spaces, the ratio of draught to depth and the number of passengers, and may not be less than 30 % of the gross tonnage26. Both are pure numbers, used for registration, port dues and the application of many regulations, and neither gives directly the displacement or the deadweight, which are masses.
3.3 The centre of gravity of a loaded ship
3.3.1 Moments about three reference planes
The second condition of equilibrium needs the position of G, which is found from the masses on board and their positions by taking moments. If the item of mass has its centre of gravity at , the centre of gravity of the whole is at
where the moments are taken about three reference planes: the transverse plane through the AP, the centreplane and the plane of the baseline. Measuring from the AP keeps nearly every longitudinal position positive, which avoids the sign errors that come with distances forward and aft of amidships22. The calculation is laid out as a table with a row for each item and columns for the mass, the three coordinates and the three moments, as in Table 3.1; the totals of the moment columns, divided by the total mass, give the coordinates of G.
An item removed from the ship is entered in the table with a negative mass. The centre of gravity of a liquid is the centroid of the liquid’s volume in its tank. The tank’s capacity tables give it, with the volume, against the sounding, the depth of liquid measured in the tank. When a tank is partly full, that centroid moves as the ship heels, and this gives rise to the free surface effect (Chapter 5). For stability calculations a load hanging from a crane is entered at its point of suspension, because its weight acts vertically downwards through that point whether the ship is upright or heeled23. Changes to the condition are entered as new rows, and the table then always shows where every number comes from.
Example 3.3. A loading condition. The masses of a cargo ship built on the Series 60 hull ( = 121.92 m, = 9.754 m) as it leaves port are listed in Table 3.1, with their centres of gravity (Fig. 3.5). The cargo is homogeneous and fills the five holds, so each hold carries a mass in proportion to its volume, centred at the centroid of the hold. The liquids, of density 0.98 t/m³ for the fuel oil, 0.85 t/m³ for the diesel oil, 0.90 t/m³ for the lubricating oil and 1.000 t/m³ for the fresh water, are centred at the centroids of the volumes they fill in their tanks. Find the displacement mass, the position of G and the deadweight in this condition, and the deadweight and the deadweight coefficient at the summer draught, taking the summer load line at the design waterline, where the displacement mass is 7901.8 t. The masses are illustrative (Notes on the data).
Table 3.1 The departure condition of the Series 60 cargo ship. forward of the AP, to port, above the baseline; DB, double bottom. The numbers in the first column are those of Fig. 3.5.
No. Item (t) (m) (m) (m) (t·m) (t·m) (t·m) 1 Lightship 2850 57.58 0 6.85 164,103.0 0 19,522.5 2 Crew and effects 20 40.00 0 12.60 800.0 0 252.0 3 Stores and provisions 15 36.00 0 10.80 540.0 0 162.0 4 Fuel oil, DB tank 3, port 190 56.23 3.44 0.62 10,683.7 653.6 117.8 5 Fuel oil, DB tank 3, starboard 175 56.23 −3.41 0.57 9,840.3 −596.8 99.8 6 Diesel oil 35 35.03 0 0.44 1,226.1 0 15.4 7 Lubricating oil 12 40.01 0 0.56 480.1 0 6.7 8 Fresh water 110 5.74 0 6.22 631.4 0 684.2 9 Cargo, hold 5 848 20.90 0 6.20 17,723.2 0 5,257.6 10 Cargo, hold 4 1528 56.03 0 5.50 85,613.8 0 8,404.0 11 Cargo, hold 3 960 75.80 0 5.53 72,768.0 0 5,308.8 12 Cargo, hold 2 693 91.28 0 5.69 63,257.0 0 3,943.2 13 Cargo, hold 1 271 105.68 0 5.88 28,639.3 0 1,593.5 Total 7707 456,305.9 56.8 45,367.5
The condition inside the hull is drawn in Fig. 3.5. The aft peak is the space at the after end of the hull, abaft the aftermost watertight bulkhead. The double bottom (DB) is the space between the bottom shell and an inner bottom, whose upper surface, the tank top, is the floor of the holds; a centre girder, a longitudinal plate on the centreline of the double bottom, separates the port and starboard tanks. In this general cargo ship the deadweight is carried low: its own centre of gravity, found from the totals by removing the lightship, is m above the baseline, against 6.85 m for the lightship, and loading this ship lowers G. In the four merchant ships of Sec. 3.2.2, G falls between the lightship and the full-load condition from 73 % to 60 % of the depth in the bulk carrier and from 75 % to 73 % in the LNG carrier, but rises from 61 % to 71 % in the container ship and from 53 % to 57 % in the tanker22. In the ship of Table 3.1, burning fuel from the double bottom raises G, and on arrival, with the fuel, diesel oil, fresh water and stores reduced to about a tenth (Exercise 3.10), the displacement mass falls to 7236 t and KG rises to 6.13 m. The transverse position is 0.007 m rather than zero, because the port fuel tank holds 15 t more than the starboard tank, and the ship will lie with a small list. Whether the ship floats level depends on and on at the draught at which it floats.
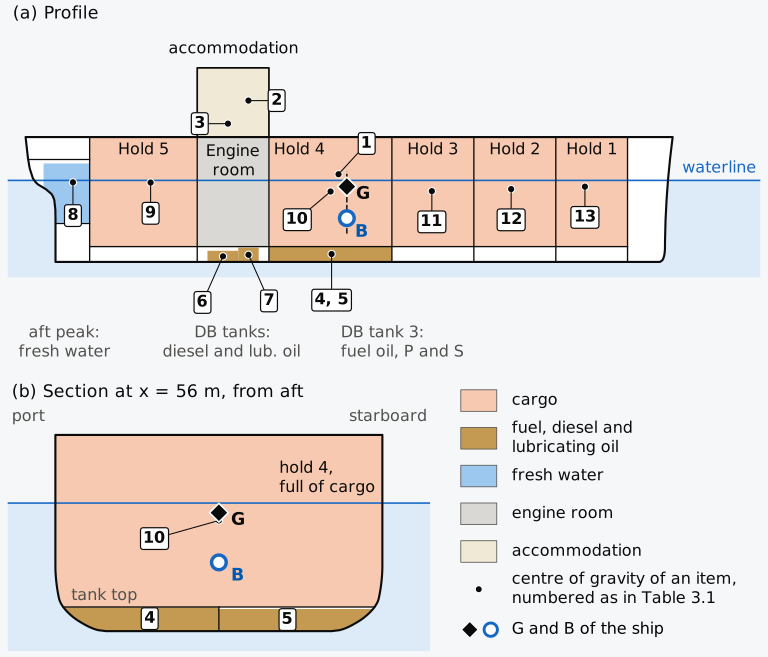
Figure 3.5 The departure condition of the Series 60 cargo ship: (a) profile, with each item’s centre of gravity numbered as in Table 3.1; (b) the section through hold 4 and double-bottom tank 3. Heights in (a) are exaggerated 2.5 times; (b) is to scale. The arrangement is illustrative (Notes on the data).
The volume of hold that a tonne of cargo occupies is its stowage factor27. With the 557 t of fuel, oils, fresh water, stores and crew of Table 3.1 on board, the ship can carry t of cargo at its summer draught, less on a longer voyage that needs more fuel. Its holds take 9325 m³, so a cargo stowing at m³/t would fill the holds just as the ship reached its marks. The cargo of Example 3.3, at 2.17 m³/t, has a higher stowage factor, and the ship is limited by the volume of its holds; a cargo stowing at 1.80 m³/t would bring the ship to its marks with about 1230 m³ of hold still empty, and the ship would be limited by weight. A ship designed for cargoes of low stowage factor is limited by weight and needs as much displacement as its main dimensions allow, so it is given a full form and loaded deep, to a low freeboard. A ship designed for cargoes of high stowage factor is limited by the volume of its holds and needs depth for them, so its freeboard is high, and a finer form lets it float deep enough with its light cargo to immerse its propeller27.
3.3.2 Margins and the growth of weight
A weight estimate made during design is never complete, and its errors are mostly omissions: items forgotten, steel delivered heavier than its nominal thickness within the mill tolerance, piping and cables that cannot be estimated well until they are designed22. Designers therefore add margins to the estimated lightship mass and to the height of its centre of gravity. Moore’s account of contract design gives margins of 1.5–2.5 % of the lightship mass and 0.15–0.23 m on the height of its centre of gravity for cargo ships, and 2.5–3.5 % and 0.23–0.30 m for large passenger ships; the smaller values apply where the estimate rests on a reliable basis22. The same source describes US Navy service-life allowances of 5–10 % of the weight and 0.15–0.75 m on the height of the centre of gravity for future modifications and additions22. These are examples of design practice, not universal allowances; the project must set its own margins and track how much remains as the design develops. HMS Captain, for example, came out heavier than designed, although the figures differ between sources: more than two feet (0.6 m) deeper than designed at its launch in one account28, and a freeboard of 6 ft 6 in (2.0 m) against the 8 ft (2.4 m) intended, 1 ft 6 in (0.46 m) less, in the figures given in 1871 to the House of Lords29. Both have the ship floating deeper than designed.
3.4 The draught at which a ship floats
With the displacement and G known, the first condition of equilibrium fixes the draught, through the curve of volume against draught built up from the waterplane areas, and the second determines whether the ship floats level.
3.4.1 The displacement curve
The volume of the hull below a waterline at height is the running integral of the waterplane areas,
and is the displacement mass at that draught. Plotted against draught, it is the displacement curve (Fig. 3.6(a)); in fresh water every displacement on it is smaller in the ratio of the two densities. The draught at which a ship of known mass floats is read from the curve, or interpolated in a table of displacement against draught.
3.4.2 Tonnes per centimetre immersion
Differentiating the volume with respect to draught shows that the displacement mass increases with draught at the rate
the mass of a layer of water of the area of the waterplane and unit thickness. With in t/m³ and in m², the mass needed to sink the ship by one centimetre is the mass of the layer shaded in Fig. 3.4 when = 1 cm, the tonnes per centimetre immersion,
and in water of density the TPC is the sea-water value multiplied by for a given waterplane. Multiplied by , the TPC is also the stiffness of the heave spring for each centimetre: the 14.38 t/cm of the Series 60 hull at its design draught corresponds to 141 kN/cm.
The TPC changes with draught as the waterplane does (Fig. 3.6(b)). Near the keel of a ship with a flat bottom it rises quickly; over the working range it changes slowly, and for the Series 60 hull it increases above the design waterline, because the ends of the hull flare outwards. A ship whose sides are vertical over a range of draught is called wall-sided over that range; its TPC is then constant there.
Historical note: Deane and Hudde
Displacements at several waterlines were computed long before there was a theory of stability. The shipbuilder Anthony Deane (1638–1721) computed them for a design up to the waterline intended below its gunports. Once the ship was launched and its light displacement known, he could find how much armament, ballast and stores would bring it down to that waterline17. In 1652 the Dutch mathematician Johannes Hudde proposed weighing a cargo by the difference between the draughts of the ship empty and laden, multiplied by waterplane areas measured on the ship itself and by the density of sea water, much as a mass is found today from a change of draught and the TPC; the proposal was never used17.
3.4.3 The draught from a hydrostatic table
Near the design draught the displacement mass, the TPC and the centres of the Series 60 hull are tabulated in Table 3.2; over the whole depth the displacement and the TPC are plotted in Fig. 3.6.
Table 3.2 Hydrostatic values of the Series 60 hull in sea water ( = 1.025 t/m³), upright and at even keel. and are measured forward of the AP.
| (m) | (t) | TPC (t/cm) | (m) | (m) | KB (m) |
|---|---|---|---|---|---|
| 5.6 | 6632.3 | 13.74 | 59.56 | 57.73 | 3.000 |
| 5.8 | 6908.5 | 13.88 | 59.48 | 57.39 | 3.108 |
| 6.0 | 7187.7 | 14.03 | 59.39 | 57.02 | 3.217 |
| 6.2 | 7469.9 | 14.18 | 59.29 | 56.68 | 3.326 |
| 6.4 | 7754.9 | 14.32 | 59.19 | 56.38 | 3.435 |
| 6.6 | 8042.5 | 14.45 | 59.09 | 56.13 | 3.545 |
| 6.8 | 8332.7 | 14.57 | 58.98 | 55.89 | 3.654 |
| 7.0 | 8625.5 | 14.71 | 58.87 | 55.65 | 3.765 |
| 7.2 | 8921.0 | 14.84 | 58.76 | 55.42 | 3.875 |
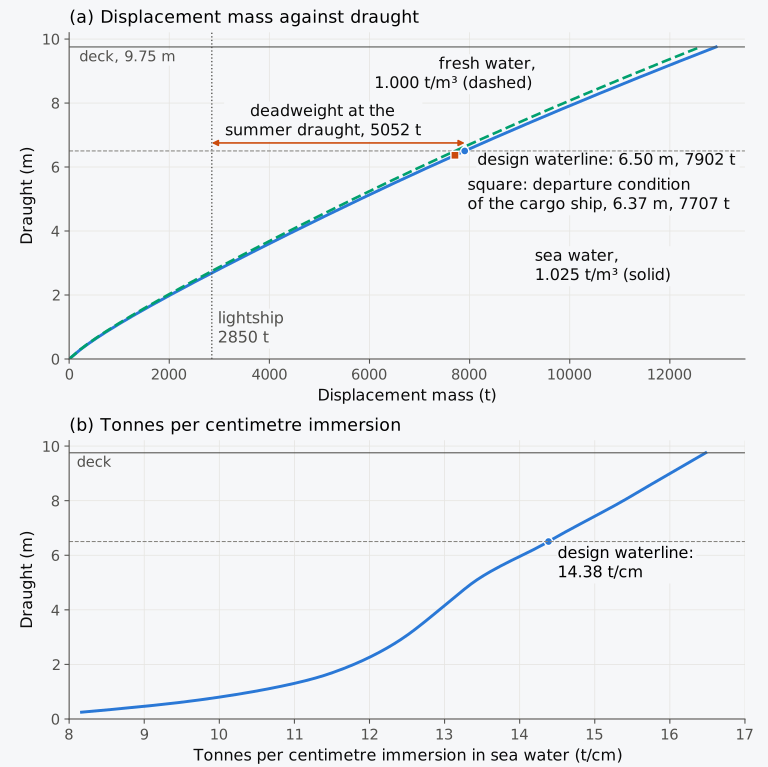
Figure 3.6 The Series 60 hull: (a) displacement mass against draught, in sea water and in fresh water, with the lightship mass and the deadweight; (b) tonnes per centimetre immersion in sea water.
Example 3.4. The draught of the loaded ship. In the departure condition, the Series 60 cargo ship has a displacement mass of 7707 t, with G 59.21 m forward of the AP, and its depth is 9.754 m. Find the draught and the centre of buoyancy from Table 3.2, decide whether the ship floats level, and find its freeboard.
3.4.4 Small loads and the centre of flotation
A small mass added to the ship sinks it by
The sinkage is parallel, the ship going down without heeling or trimming, only if the added mass is placed with its centre of gravity on the vertical through the centre of flotation F, the centroid of the waterplane. The extra buoyancy is a thin layer whose centroid lies above F, so a mass placed over F adds a weight and a buoyancy on one vertical. F should not be confused with B; in the departure condition of the Series 60 cargo ship, F lies 56.43 m forward of the AP and B, with G above it, 59.21 m, and a mass placed over B would lie 2.8 m forward of F and trim the ship by the head. F also moves with the draught; in Table 3.2 it moves aft from 57.73 m to 55.42 m forward of the AP as the draught increases from 5.6 m to 7.2 m. A mass placed elsewhere, at and , can be treated as first placed over F, causing a parallel sinkage, and then moved to its actual position; the move adds a trimming moment about F and a heeling moment, of magnitudes and , which trim the ship towards the end and heel it towards the side on which the mass lies22,24. A ship that trims slightly at constant displacement turns about F, so the draught at F stays at the equivalent even-keel draught, the draught at which the ship would float level with its displacement unchanged; this holds only while the trim is small.
3.4.5 Large loads
Equation (3.13) treats the waterplane as constant between the two waterlines. For a larger change the displacement curve is used. Without it, the change is first estimated with the TPC at the initial draught, the TPC is read at the draught so estimated, and the change is computed again with the mean of the two TPCs23. This assumes that the TPC varies linearly with draught over the change. A mass large enough to change the waterplane sinks the ship without trim only if it is placed over the centroid of the layer that it immerses, which lies close to F at the draught midway between the two waterlines.
Example 3.5. Loading and discharging large masses. The loaded Series 60 cargo ship floats at a draught of 6.367 m, where its TPC is 14.30 t/cm. It (a) loads a further 600 t over the centroid of the added layer, so that the ship sinks without trim; (b) instead discharges all 4300 t of its cargo. Find the change of draught in each case from the TPC at the initial draught, refine the estimate with a mean TPC, and compare with the displacement curve. (The holds are already full and the ship is 195 t short of its summer load line, so the 600 t of (a) is a notional mass, chosen to show the method. In (b) the cargo is not over F, so the ship also trims; the displacement then fixes the equivalent even-keel draught, and the draughts at the ends depend on the trim.)
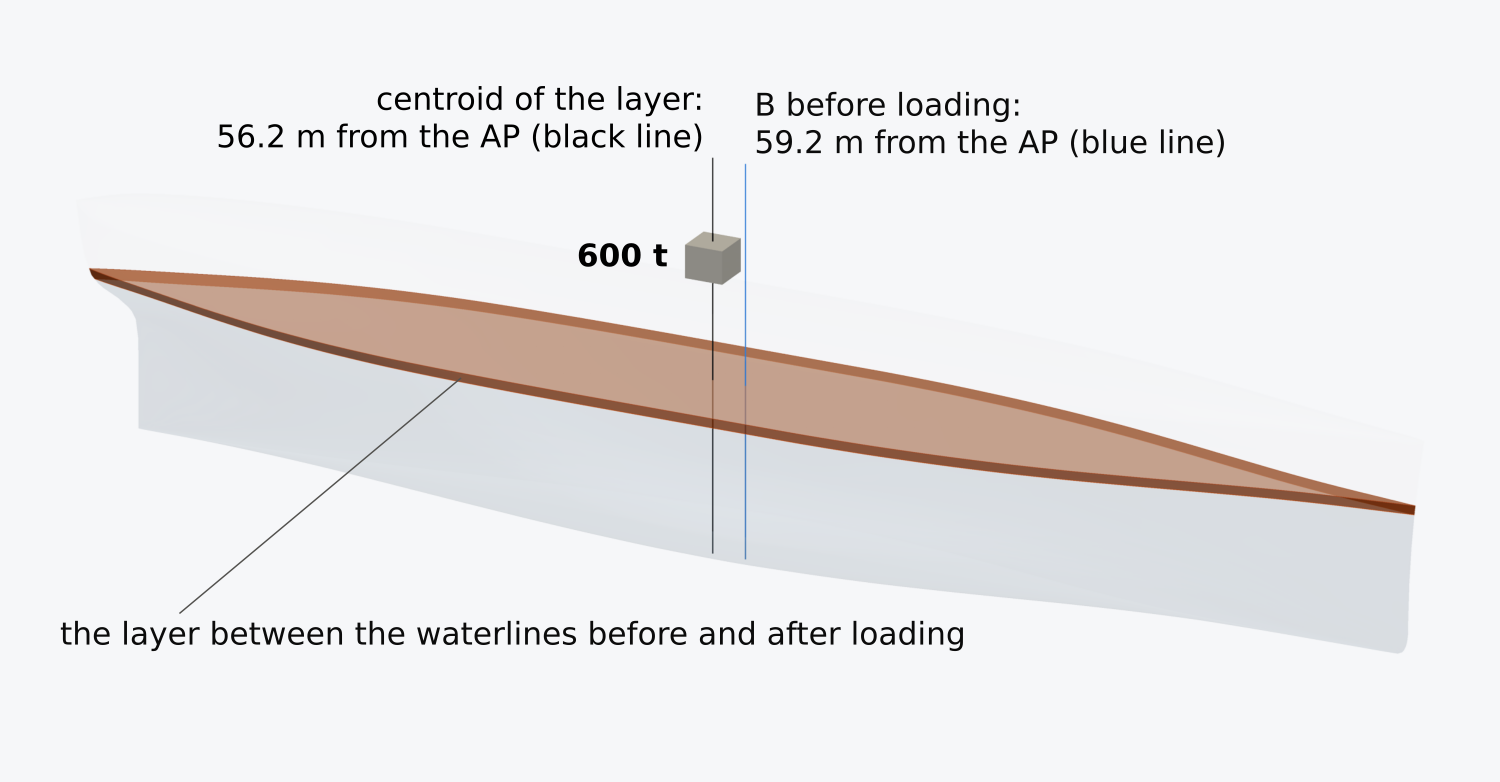
Figure 3.7 The layer between 6.367 m and 6.782 m added when the loaded Series 60 ship takes on the notional 600 t of Example 3.5(a) over the centroid of the layer. Heights are drawn twice as large as lengths and breadths.
3.4.6 Shell and appendages
The Series 60 hull is a moulded surface, and its moulded volume has so far been taken as the whole displaced volume. A real steel ship displaces more. The shell and appendages of a single-screw cargo ship add slightly less than 1 % to its moulded volume, and the shell plating about 0.75 % of that volume27. If the total is times the moulded volume at every draught, the first condition of equilibrium becomes
where is the moulded volume.
Example 3.6. The effect of the shell and appendages. Suppose the Series 60 ship’s shell and appendages add = 0.9 % to its moulded volume. By how much does neglecting them overestimate the draught at the design displacement mass of 7901.8 t, where the waterplane area is 1403.3 m², and how much more can the ship carry at its summer draught?
A draught survey finds the cargo from the draughts read before and after loading, and it aims to fix to within ±10 mm the draught at which it enters the hydrostatic tables30. An error of 4.9 cm is five times that tolerance, and the allowance cannot be neglected when a ship’s displacement is inferred from its draughts. It matters less in comparative design studies, where one hull form is used throughout. The allowance is usually a smaller fraction of the volume for larger ships15, because the area of the shell grows with the square of the size and the volume with its cube, while the plating thickens more slowly than the ship grows.
3.4.7 From a weight table to the draught (Calculator 3.1)
Calculator 3.1 adds up a weight table by taking moments, as in Example 3.3, and, for a ship on the Series 60 hull, finds the equivalent even-keel draught from the hull’s displacement curve and compares with at that draught. Enter one item per line as name, mass (t), , and (m), with a negative mass for an item removed. The working shows the totals, the moments and the centre of gravity, then the draught and the centre of buoyancy, and says whether the ship would float level, trim or list. It does not say whether the ship is stable, because that depends on how high G is compared with how far B moves when the ship heels, and the calculator’s answer does not depend on the KG entered.
3.5 Water of different density
Through the first condition of equilibrium, the density of the water enters every calculation of draught and displacement. A ship that moves from the sea into a river, or loads in an estuary, floats at a different draught for a given mass on board.
3.5.1 Density of sea, river and fresh water
The density of water depends on its temperature and on the amount of salt dissolved in it. The values recommended by ITTC procedure 7.5-02-01-03, Rev. 03, computed from the international equations of state, give sea water of standard salinity a density of 1027.7 kg/m³ at 5 °C, 1026.0 kg/m³ at 15 °C and 1023.4 kg/m³ at 25 °C, and fresh water 999.97, 999.10 and 997.05 kg/m³ at 5, 15 and 25 °C31. The density of the water in a river mouth or a dock lies anywhere between, and in a tidal estuary it changes with the tide, so for any accurate work it is measured at the time and place the draughts are read30.
Regulations use two nominal values instead: 1.025 t/m³ for sea water and 1.000 t/m³ for fresh water. The summer deadweight is defined in sea water of 1.025 t/m³, and the fresh water allowance and the load lines assume these two values. They are conventions, close to the physical densities over most of the oceans and in rivers, and they are used in every calculation unless another density is stated.
The relative density of a liquid, formerly called its specific gravity, is its density divided by that of fresh water23. Taking fresh water as 1.000 t/m³, as the load line rules do, the relative density and the density in t/m³ are numerically equal, and a rule written for water of specific gravity 1.025 means sea water of 1.025 t/m³; against the actual density of fresh water at a stated temperature the two differ in the third decimal place. The density of the water alongside is measured with a hydrometer, a weighted float with a narrow graduated stem, which floats with its weight equal to its buoyancy23. A hydrometer of mass , whose bulb has a volume below a uniform stem of cross-section , floats in water of density with a length
of its stem immersed. The length varies as , so equal steps of density are not equally spaced on the stem, and an instrument made for densities between 1.000 and 1.025 t/m³ has a long stem of small section to spread them out (Exercise 3.19).
3.5.2 Sinkage when the density changes
A ship of mass that moves from water of density into water of density keeps its mass, so its displaced volume changes from to , by
If the ship is wall-sided between the two waterlines, the extra volume is a layer of area , and the ship sinks by . Writing , with the value in the first water,
A box sinks exactly in the ratio of the densities, , at any draught. Since the layer added lies around F and not around B, the centre of buoyancy also moves along the ship; for the Series 60 hull going from sea water into fresh water, B moves 0.07 m aft, leaving G slightly forward of it, and the ship trims slightly by the head. B also rises with the deeper draught, and at the design displacement KB goes from 3.491 m to 3.566 m, 75 mm higher; KB is one of the heights on which the stability of the ship depends.
3.5.3 The fresh water allowance
For a ship going from sea water ( = 1.025) into fresh water ( = 1.000), Eq. (3.15) gives an extra volume of , one fortieth of the volume displaced in sea water, which forms a layer over the waterplane of a wall-sided ship (Fig. 3.8(a)). The thickness of the layer, centimetres, is the fresh water allowance
The International Convention on Load Lines, 1966 (the Load Line Convention), gives the same allowance, with the displacement mass and the TPC both taken in sea water at the summer load waterline32. The disc of 1875 marked the deepest waterline in salt water, and the FWA is how much deeper a ship loaded to that line floats in fresh water. It is exact for a ship wall-sided over the band between the two waterlines, with the nominal densities; the only approximation is any change of the waterplane within that band. Writing and , it also takes the form
which shows that the allowance is fixed by the draught and the vertical prismatic coefficient. Where the displacement at the summer waterline cannot be certified, the Convention takes the allowance instead as one forty-eighth of the summer draught32. By Eq. (3.18), corresponds to . A box, with , needs , more than the default; the Wigley hull, with , needs , and overstates its allowance by 25 % (Fig. 3.8(b)).
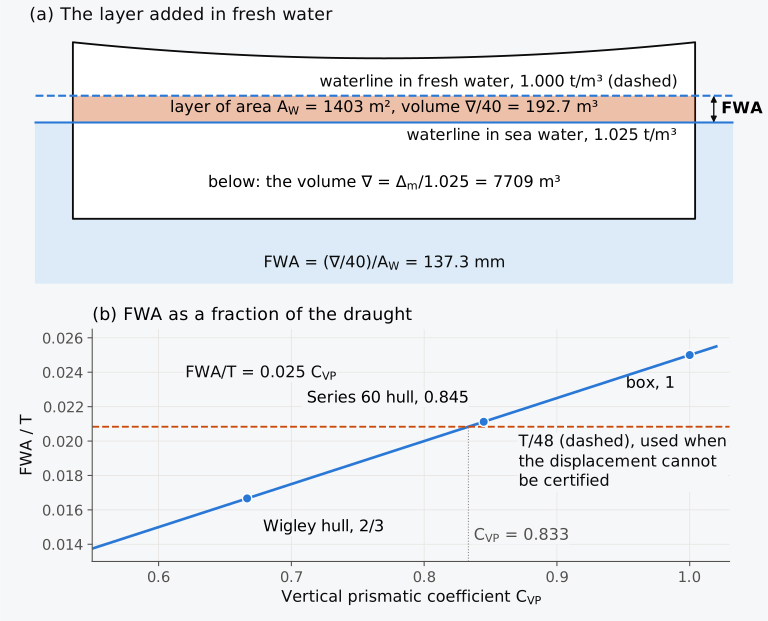
Figure 3.8 The fresh water allowance: (a) the layer that holds one fortieth of the displaced volume of the Series 60 ship at its summer draught, vertical scale exaggerated; (b) the allowance as a fraction of the draught, against the vertical prismatic coefficient.
Example 3.7. The fresh water allowance of the Series 60 ship. Take the summer draught of the Series 60 ship at its design draught, 6.502 m, where = 7901.8 t, TPC = 14.384 t/cm and = 0.845. Find the FWA from the displacement and the TPC and from the coefficients, and compare it with and with the sinkage computed on the surface.
3.5.4 A fixed draught in different water
At a fixed draught the displaced volume is fixed, and the displacement mass is proportional to the density:
At its summer draught the Series 60 ship displaces 7902 t in sea water and 7709 t in fresh water, 193 t less. A displacement read from tables computed for sea water is corrected in this way for the density of the water in which the draughts were read30, as is done in a draught survey.
3.6 Displacement from the draughts
So far the draught has been found from the masses on board. Reading the draughts and working back to the masses is the reverse problem, and it is how a bulk cargo is weighed when there is no scale ashore. The displacement of a ship afloat is found from its draughts, read on the marks forward, amidships and aft on both sides. Where the ship is listed, the mean of the port and starboard readings at each mark is the draught at the centreline. The marks show keel draughts and are not exactly at the perpendiculars, so their readings must be reduced to moulded draughts at the perpendiculars, and to the centre of flotation when the ship is trimmed. In the examples and exercises of this chapter, the readings are taken as moulded draughts at the perpendiculars and amidships, and the trim is taken to be small.
3.6.1 Hog and sag
A hull is not rigid. Under its weights and its buoyancy it bends a little along its length, and the keel is no longer straight; a ship is hogged when its keel is concave downwards and sagged when it is concave upwards22. The bending is found by comparing the midship draught with the mean of the end draughts22,23. If is the greater, the ship is sagged, and if the smaller, hogged, by
(Fig. 3.9(a)). Neither the mean of the end draughts nor the midship draught then gives the displaced volume. Taking the deflection of the keel from the straight line through the end draughts as a parabola, with , zero at the perpendiculars and amidships22, each strip of the waterplane, of breadth , is immersed deeper by , and the displaced volume grows by . Divided by the waterplane area , this is the amount by which the mean of the end draughts must be increased before the hydrostatic tables are entered:
For a rectangular waterplane , the area under a parabola being two-thirds of the rectangle around it. A waterplane with fine ends has more of its area amidships, where the deflection is largest, and a larger ; for the Series 60 hull it is 0.793 at the design draught and 0.834 at 3 m (Fig. 3.9(b)). In practice is taken22, which gives the mean of means,
the formula used in the draught survey23. Since , it weights the midship draught six times as heavily as each end draught. For the Series 60 ship the factor 3/4 understates the correction by about 0.04 of the sag.
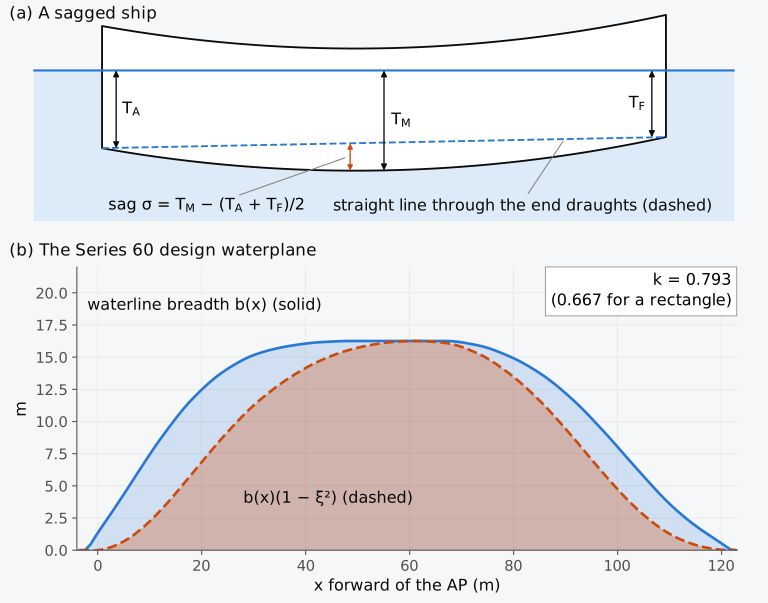
Figure 3.9 Draughts of a bent hull: (a) a sagged ship, vertical scale exaggerated; (b) the waterline breadth of the Series 60 hull at its design draught, plain and weighted by the parabolic deflection, the weighting applied between the perpendiculars. The ratio of their areas is the factor .
The midship draught also determines when a ship is loaded to its summer load line, because the load line mark is amidships. A sagged ship with its summer load line at the waterline floats at a mean draught that is less than the summer draught by , and so it carries less than its summer displacement, by about times the TPC, with in metres and the TPC in tonnes per centimetre. A hogged ship, conversely, reaches its summer load line with more on board than a straight ship would.
3.6.2 The draught survey
When a bulk cargo such as coal, ore or grain cannot be weighed ashore, or as a check on the shore figure, the ship is used as the scale. A draught survey reads the draughts before and after loading or discharge, finds the displacement each time and subtracts the changes in everything that is not cargo. The procedure set out by the UK P&I Club30, an insurer of shipowners’ protection and indemnity (P&I) risks, is typical. The draughts are read forward, amidships and aft on both sides (Fig. 3.10); the readings are corrected to the perpendiculars and for trim, and for the bending of the hull by the mean of means; the displacement is read from the hydrostatic tables and corrected for the density of the water; and the ballast, fuel and fresh water, found by sounding every tank, are deducted. In the survey before loading, what remains of the displacement after the lightship and the known deductions is the constant, the unaccounted mass of stores, spares, sediment and the like. It should not come out negative; if it does, the survey or the lightship mass is in error. Barrass and Derrett23 use the word for the cargo deadweight instead; it is used here only in the sense defined above.
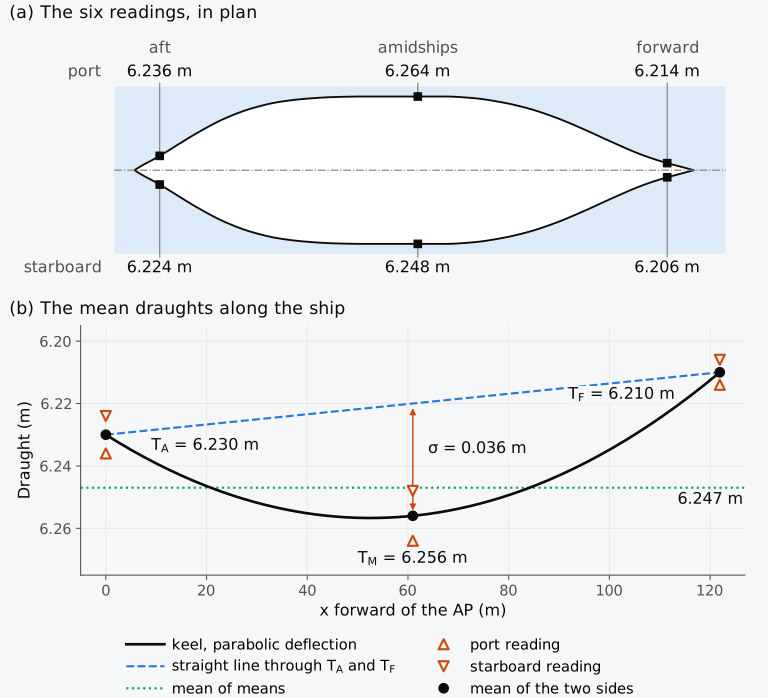
Figure 3.10 The draught marks of the Series 60 cargo ship in Example 3.8: (a) the six readings, in plan, breadths drawn twice as large as lengths; (b) the means of the two sides, at the perpendiculars and amidships.
Example 3.8. A draught survey. The Series 60 cargo ship has finished loading at a river berth. The readings at its draught marks, reduced to moulded draughts and taken to be at the perpendiculars and amidships, are 6.214 m to port and 6.206 m to starboard forward, 6.264 m and 6.248 m amidships, and 6.236 m and 6.224 m aft. A hydrometer gives the density of the water at the berth as 1.012 t/m³. Soundings and the stores list give 96 t of ballast water, 352 t of fuel oil, 30 t of diesel oil, 11 t of lubricating oil and 104 t of fresh water, with 33 t of crew, effects and stores; the lightship mass is 2850 t, and the survey before loading found a constant of 45 t. Find the cargo on board, and estimate how much an error of 5 mm in each mean reading, or of 0.001 t/m³ in the density, could change it.
3.7 Reserve buoyancy, freeboard and the load line
The marks on a ship’s side show the deepest waterline at which it may float in each season, zone and water. They are Plimsoll’s disc in its present form, and you now have what their positions rest on: a draught fixes a displacement, the density of the water changes the draught, and the height of the deck above the waterline fixes the reserve buoyancy.
3.7.1 Reserve buoyancy
The reserve buoyancy of a ship is the watertight volume of its hull above the waterline,
where is the volume up to the freeboard deck. Under the Load Line Convention this is normally the uppermost complete deck exposed to the weather and the sea, with permanent means of closing all openings in its weather part and with all openings in the sides below it fitted with permanent watertight closures32. Watertight superstructures, decked structures on the freeboard deck that extend to the sides of the ship or nearly so (reg. 3(10)), add to the volume. It is the volume into which the ship sinks if weight is added unexpectedly or a compartment is flooded. A heel also draws on it, because the low side immerses part of it, and once the deck edge is under, little of it is left on that side and the righting lever soon falls, as Captain’s did18 beyond about 21°. The Series 60 hull at its design waterline has a reserve buoyancy of 4899 m³, 64 % of its displaced volume and 39 % of its watertight volume (Fig. 3.11).
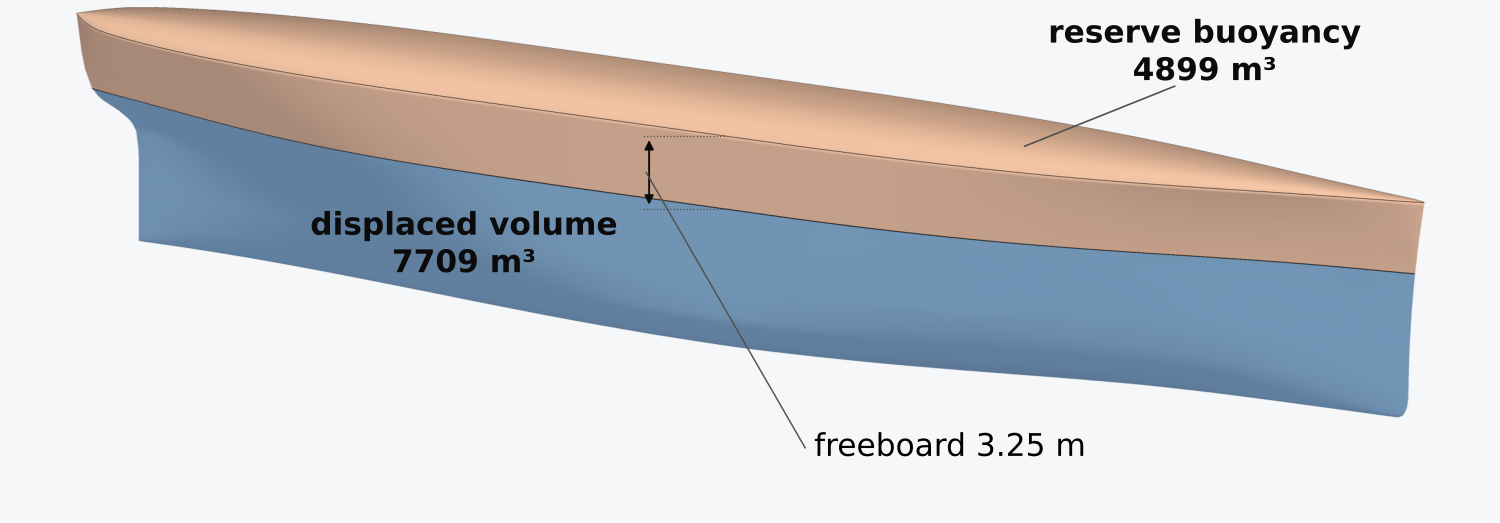
Figure 3.11 Displaced volume and reserve buoyancy of the Series 60 hull at its design waterline. Heights are drawn twice as large as lengths and breadths.
Predict 3.1. The rule of the trade that Plimsoll cited, published by Lloyd’s Register in 1835, allowed three inches of freeboard for every foot of depth of hold. Apply it to a hull shaped like a box, whose depth of hold is its whole depth . How large is the reserve buoyancy, as a fraction of the displaced volume?
3.7.2 The deck line and the load line mark
The disc of 1875 was a requirement of British law; international agreement came later, with a convention on load lines33,34 that was signed in London on 5 July 1930 and came into force on 1 January 1933. It was replaced by the International Convention on Load Lines, 1966, in force from 21 July 1968. A Protocol of 1988, in force from 3 February 2000, modified that convention35. The regulations that assign freeboards today were rewritten in 2003 by Resolution MSC.143(77) of the Maritime Safety Committee of the International Maritime Organization (IMO), and apply to ships whose keels were laid from 1 January 2005 onwards36 (Fig. 3.12).
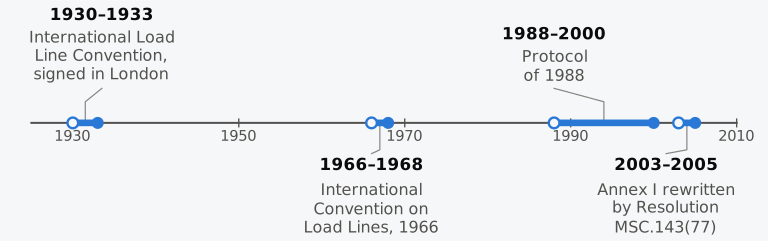
Figure 3.12 The international conventions on load lines, 1930 to 2005. Each bar runs from adoption, an open circle, to entry into force, a filled circle.
The freeboard that the Load Line Convention assigns is measured on the ship’s side by marks whose form and size it prescribes (Fig. 3.13). The deck line is a horizontal line 300 mm long and 25 mm wide, which the Convention requires to be marked amidships on each side, with its upper edge where the upper surface of the freeboard deck, continued outwards, meets the outer surface of the shell32. The load line mark is a ring of 300 mm outside diameter and 25 mm width, crossed by a horizontal line 450 mm long and 25 mm wide whose upper edge passes through the centre of the ring; the centre of the ring is placed amidships, at the assigned summer freeboard below the upper edge of the deck line (reg. 5). The freeboard is measured vertically downwards amidships, from the upper edge of the deck line to the upper edge of the related load line (reg. 3(8)). It differs from the geometric freeboard by the thickness of the deck plating at the side. The ring and its line keep the proportions of Plimsoll’s disc of 1875, 12 inches (305 mm) across with a line 18 inches (457 mm) long, and the deck line is the line below which the owners of 1875 and 1876 stated the distance of the disc.
Under the Convention, the lines for the seasons and for fresh water are 230 mm long and 25 mm wide and are marked on a vertical line 25 mm wide, 540 mm forward of the centre of the ring: the summer, tropical, winter and winter North Atlantic lines, S, T, W and WNA, extend forward of the vertical line, and the fresh water lines F and TF abaft it. In every case the load line is the upper edge of the line (reg. 6). The initials of the authority that assigned the freeboard, no more than four letters about 115 mm high and 75 mm wide, may be marked beside the ring, above its horizontal line or above and below it (reg. 7), and the whole mark is painted in white or yellow on a dark ground or in black on a light ground, and permanently marked on the plating (reg. 8). Ships assigned timber freeboards have a second set of lines abaft the ring. Because the load line is the upper edge, a ship whose line just shows its full width above the water is still 25 mm clear of it. On a listed ship the mark is read on both sides and the mean taken, as at the draught marks23.
3.7.3 Assigning the summer freeboard
The summer freeboard comes from the regulations of Annex I, chapter III, of the Convention. In outline, ships are of type A, designed to carry only liquid cargoes in bulk, with an exposed deck of high integrity pierced only by small, gasketed access openings and with cargo compartments of low permeability, the fraction of a space that flood water can fill, or of type B, all others32. A tabular freeboard, read from one of two tables against the ship’s length between 24 m and 365 m (reg. 28), is corrected for ships under 100 m, for a block coefficient above 0.68, for a depth greater than , for the position of the deck line, for superstructures and for trunks, structures like superstructures that do not extend to the sides (reg. 36), and for sheer (regs 29–38). The ship must also have a minimum bow height, the height of the deck at side above the summer waterline at the forward perpendicular, set by a formula in the length, the block coefficient, the fullness of the waterplane forward of amidships and the draught at 85 % of the least moulded depth (reg. 39(1)). Type B ships other than oil tankers, chemical tankers and gas carriers need in addition a minimum reserve buoyancy forward (reg. 39(5)). Sheer and a forecastle add to both; a sheer or a forecastle that provides the bow height must extend a stated distance aft of the forward perpendicular (reg. 39(2)). Type B ships over 100 m may be assigned less freeboard if they can survive flooding of specified compartments (reg. 27(8)–(10)). Whatever the tables give, the salt-water freeboard may not be less than 50 mm (reg. 40(2)), and a ship built on or after 1 July 2010 must also meet part A of the Intact Stability Code (reg. 1(3), as amended by Resolution MSC.270(85)). The Administration, the government of the state whose flag the ship flies (art. 2(2)), must also be satisfied that its structure is strong enough for the draught assigned (reg. 1(1)). Length and depth in these regulations are defined by the Convention and differ from the length between perpendiculars and the moulded depth; the Convention length , for example, is 96 % of the length on a waterline at 85 % of the least moulded depth, or the length from the stem to the rudder stock on that waterline if greater (reg. 3(1)).
3.7.4 Zones, seasons and the lines
Which line applies depends on where the ship is and when. The Convention divides the oceans into zones and seasonal areas on the basis of wind statistics. A summer zone has no more than 10 % of winds of Beaufort force 8 (34 knots, 17.5 m/s) or more; a tropical zone has no more than 1 % of such winds and no more than one tropical storm in ten years in any 5° square in any calendar month; seasonal zones change between summer and winter, or summer and tropical, during the year32. Under the Convention, a ship must not have the line appropriate to its zone and season submerged when it puts to sea, during the voyage or on arrival32, and in a port on the boundary of two zones the rule of the zone from which it arrives or into which it departs applies (art. 11).
The Convention sets the freeboards of the other lines from the summer freeboard , the summer draught , measured from the top of the keel to the centre of the ring, and the FWA32:
Table 3.3 Minimum freeboards relative to the summer freeboard .
| Line | Freeboard | Applies |
|---|---|---|
| Summer, S | in summer zones and seasons | |
| Tropical, T | in the tropical zone | |
| Winter, W | in winter zones and seasons | |
| Winter North Atlantic, WNA | mm | ships of Convention length ≤ 100 m, in the North Atlantic in winter; for longer ships it is the winter freeboard |
| Fresh, F | in fresh water, summer | |
| Tropical fresh, TF | in fresh water, tropical zone |
The tropical and winter lines are therefore each from the summer line, and the fresh water lines are one FWA above the summer and tropical lines, which is where the FWA can be read on the ship. Under the Convention, a winter North Atlantic line that coincides with the winter line is marked W32. The order of F and T depends on the hull; F lies above T when , that is, when .
Example 3.9. The marks of the Series 60 ship. The Series 60 ship has a moulded depth of 9.7536 m, a design draught of 6.5024 m and, at that draught, a fresh water allowance of 137.3 mm. Take the summer draught as the design draught and the upper edge of the deck line 12 mm above the moulded deck, for the thickness of the deck plating. Find the summer freeboard and the freeboards of the other lines. (The summer freeboard is therefore fixed by the chosen draught rather than computed from the regulations of Annex I outlined above, and it is assumed to be no less than the minimum they would give. The Convention allows an Administration to assign a freeboard greater than that minimum32. The ship is also assumed to have the sheer or forecastle forward that the minimum bow height of the Convention requires and that the hull surface does not model32.)
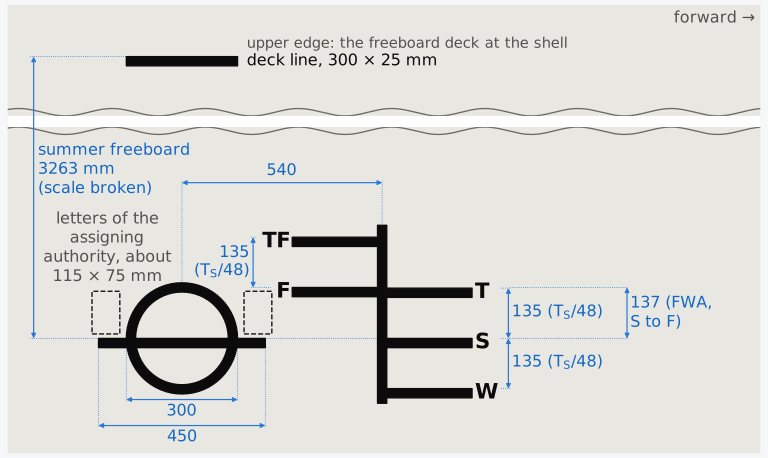
Figure 3.13 The deck line, the load line mark and the load lines of the Series 60 ship (Example 3.9), in millimetres, to scale except for the break between the deck line and the ring. Each load line is the upper edge of its line.
3.7.5 Water of intermediate density
In water whose density lies between 1.000 and 1.025 t/m³, the Convention allows the load line to be submerged by an amount proportional to the difference between 1.025 and the actual density32. Its usual working form, the dock water allowance, interpolates linearly between the S and F lines (Fig. 3.14(a)):
The exact wall-sided sinkage, Eq. (3.16), has in place of 1.000 in the denominator, so the linear rule overstates it by the factor , by less than 2.5 %. Since the allowance shrinks to zero as approaches 1.025, the absolute difference stays small; for the Series 60 ship, whose flared ends reduce the sinkage a little further, the rule and the sinkage computed on the surface never differ by more than 1.0 mm (Figs. 3.14(b) and 3.14(c)). The Convention also allows a ship leaving a river or an inland port to be loaded deeper by the mass of the fuel and other consumables it will use between leaving the berth and reaching the sea32, since that mass will be gone by the time the mark must be clear.
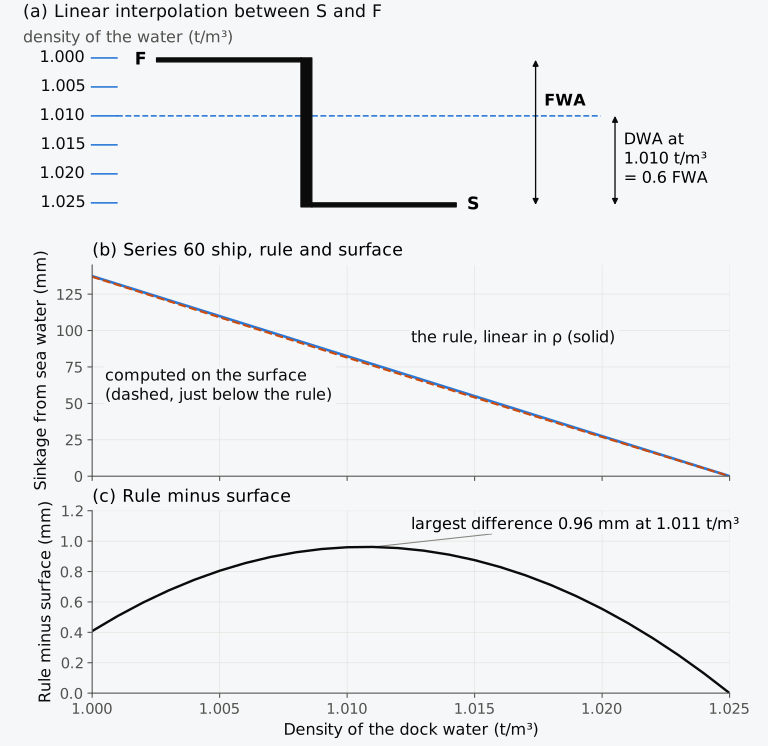
Figure 3.14 The dock water allowance: (a) interpolated linearly in the density between the S and F lines; (b) for the Series 60 ship, by the rule and on the surface; (c) the difference between the two.
Example 3.10. Loading in a river port. The Series 60 ship has a summer draught of 6.502 m, a TPC of 14.38 t/cm and a fresh water allowance of 137.3 mm. It is loading at a river berth where the water has a density of 1.010 t/m³. It will use 30 t of fuel and fresh water on the way to the sea, where it must float at its summer mark. How far may the upper edge of its summer load line be submerged at the berth?
3.7.6 The deadweight scale
The master of a ship is given its deadweight against draught for sea water and for fresh water24. A deadweight scale sets side by side, for each draught, the freeboard, the displacement and the deadweight in sea and in fresh water, and the TPC in each23. On every line of the scale the freeboard plus the draught is the depth to the deck line, and the displacement minus the deadweight is the lightship mass. For the Series 60 cargo ship the scale is given in Table 3.4, computed on the surface with its lightship mass of 2850 t. It starts at 3.0 m, a little above the light draught of 2.69 m, at which the ship floats with no deadweight, and ends at the F line, where the deadweight in fresh water equals, to within a tonne, the summer deadweight in sea water, so a ship loaded to its F line in fresh water rises to its S line in the sea.
Table 3.4 Deadweight scale of the Series 60 cargo ship. The freeboard is measured to the upper edge of the deck line, 12 mm above the moulded deck, so that = 9.766 m; the lightship mass is 2850 t.
| (m) | (m) | , sea (t) | DWT, sea (t) | , fresh (t) | DWT, fresh (t) | TPC, sea (t/cm) | TPC, fresh (t/cm) |
|---|---|---|---|---|---|---|---|
| 3.000 | 6.766 | 3233.7 | 383.7 | 3154.8 | 304.8 | 12.46 | 12.16 |
| 3.500 | 6.266 | 3863.1 | 1013.1 | 3768.9 | 918.9 | 12.71 | 12.40 |
| 4.000 | 5.766 | 4504.1 | 1654.1 | 4394.3 | 1544.3 | 12.93 | 12.61 |
| 4.500 | 5.266 | 5156.1 | 2306.1 | 5030.3 | 2180.3 | 13.15 | 12.83 |
| 5.000 | 4.766 | 5819.2 | 2969.2 | 5677.3 | 2827.3 | 13.38 | 13.05 |
| 5.500 | 4.266 | 6495.2 | 3645.2 | 6336.8 | 3486.8 | 13.67 | 13.34 |
| 6.000 | 3.766 | 7187.7 | 4337.7 | 7012.4 | 4162.4 | 14.03 | 13.69 |
| 6.502 (S) | 3.263 | 7901.8 | 5051.8 | 7709.1 | 4859.1 | 14.38 | 14.03 |
| 6.640 (F) | 3.126 | 8100.0 | 5250.0 | 7902.4 | 5052.4 | 14.47 | 14.12 |
3.7.7 Exploring the draught
Explorer 3.1 floats the Series 60 cargo ship with any deadweight between nothing and the capacity of the hull, in water of a chosen density, and shows the draught, the freeboard, the TPC, the reserve buoyancy and how far the summer load line is clear of the water or submerged, with the dock water allowance in water less dense than the sea.
Predict 3.2. Will 1000 t of cargo, placed over F, sink the ship further when it has discharged all its cargo or when it is loaded to its summer draught? Decide, then check with Explorer 3.1.
3.7.8 Load line mark and density allowances (Calculator 3.2)
Calculator 3.2 computes the freeboards of the lines of the load line mark from the summer draught and freeboard, by Table 3.3, with the fresh water allowance from the displacement and the TPC, or from when the displacement cannot be certified, and the dock water allowance for a given density. Choose Example 3.9 or Exercise 3.13 to load its numbers; the question appears above the inputs and the working is set out in steps. The calculator says whether the F line lies above, below or on the T line, warns when the tropical freeboard is less than the 50 mm of the Load Line Convention, Annex I, reg. 40(2) and 40(4), and draws the mark to a uniform scale that is reduced, when needed, to show every line.
3.8 Weight, draught and load lines in industry today
The draught survey, the check on the lightship mass and the load line certificate are where the results of this chapter meet the ship in service. The practice described here is that of 2026, and the section is revised with each release.
3.8.1 Draught surveys
The draught survey procedure described earlier is that of the UK P&I Club30, and for coal cargoes a code of uniform standards and procedures for draught surveys was published by the UN Economic Commission for Europe37. The accuracy of the method depends on that of its inputs; a well-conducted survey can achieve an accuracy of ±0.5 % in reasonable conditions30, and the West of England P&I Club38 puts the typical variation of the result at 0.5–1.0 %. ISO 12745:2008, which compares methods of weighing ore concentrates39, gives coefficients of variation for draught surveys of 0.5–2.5 %, limited by wind and by layers of water of different salinity. Ballast water is the largest source of error, because every tank must be sounded, those said to be empty included30. A reading error of 2 cm in the mean draught is worth about 68 t on a small bulk carrier and 300 t on one of the largest38. Density is measured with a hydrometer. Draught-survey hydrometers read the apparent density in air, the density as it would be found by weighing the water in air, and load-line hydrometers read the relative density at 15 °C/15 °C, the density of the water at 15 °C divided by that of fresh water at 15 °C; for sea water the two readings differ by about 0.002, so the two instruments must not be confused. The load line rules mean the density in vacuo, the true mass per unit volume30; the apparent density in air is lower than that by the buoyancy of the air, about 0.001 t/m³ for sea water. Research on reading the marks automatically continues; a deep-learning method that reads draught marks from colour and near-infrared images agreed with expert readings to within 0.01 m on a validation set of 105 images40, but a ship’s remote draught gauge should not be used for a survey30.
3.8.2 Checking the lightship mass
SOLAS requires every passenger ship, and every cargo ship of 24 m in length or more, to be inclined on completion, which fixes its lightship mass and all three coordinates of its centre of gravity19. A cargo ship may be excused if a sister ship has been inclined, but a lightweight survey is still required, and an inclining is needed if the lightship mass differs from the sister’s by more than 1 % for ships of 160 m or more and 2 % for ships of 50 m or less, interpolated linearly between, or the longitudinal centre of gravity by more than 0.5 % of the length (reg. II-1/5.2). Passenger ships receive a lightweight survey at least every five years and must be inclined again if the lightship mass has changed by more than 2 % or its longitudinal centre by more than 1 % of the length19. Alterations made in service are judged by their total effect on the lightship since the last approved inclining19,41, against limits set out in Sec. 10.8. A change too small to require an amendment of the stability information, the booklet with which the master checks each loading condition, is still recorded and allowed for in the constant of the draught survey41.
How fast lightship mass grows in commercial service is not well documented. A textbook for ships’ officers gives an average gain of about 0.5 % of the lightship mass for each year in service23 but names no source for it, and a committee of the US National Academies reviewing the Coast Guard’s stability regulations could do no more than list potential sources of data on lightship growth42. Design practice allows for growth; a ship designed for the US Maritime Administration in 2017, for example, carries a service-life growth margin of 3 %, 303 t, and 0.10 m on the height of its centre of gravity43.
3.8.3 Load line surveys and certificates
A ship under the Load Line Convention carries an International Load Line Certificate, valid for no more than five years32. It is issued after an initial survey of the structure and fittings, renewed after a survey at intervals of no more than five years, and endorsed at an annual survey held within three months of each anniversary of the certificate, which checks that no alteration affects the freeboard calculations, that the fittings protecting openings and the crew are in good order and that the marks are correct and permanent32. The certificate ceases to be valid if the ship is altered so as to need a greater freeboard, if its fittings are not maintained or if the annual surveys are not endorsed (art. 19(9)). In a foreign port, an inspection under the Convention is limited to checking that the certificate is valid, that the ship is not loaded beyond the limits it allows, that the marks are where it says they are and that the ship has not been so altered as to be clearly unfit to go to sea (art. 21). The regulations continue to change in detail. On 1 January 2024 the amendments on scuppers and discharges and on downflooding openings, those through which water could get into the hull, adopted by Resolution MSC.491(104), entered into force44. On 1 January 2028 the amendments on guard rails adopted by Resolution MSC.591(111) in May 2026 are to enter into force45. Under IMO’s guidelines in FAL.5/Circ.39/Rev.2, certificates may be issued electronically46.
3.9 From flotation to stability
A ship at rest must meet both conditions of equilibrium; Fig. 3.15 summarizes how its weights and hull are used to find such a condition. The weight table gives the displacement mass and the three coordinates of G; the displacement curve gives the draught, and the hull at that draught gives the position of B. If and differ, their couple tends to trim the ship; if is not zero, it tends to heel it. Where a stable equilibrium is reached, G and B lie on one vertical. The trim is found in Chapter 6 and the angle of list in Sec. 4.8.2. You can therefore say at what draught a ship floats and whether it floats level; you cannot yet say whether it will stay upright when something heels it. That depends on the heights of G and B and on how B moves as the ship heels. At a given draught the hull fixes both B and its movement. The conditions of equilibrium do not fix the height of G; the loading does, and G moves whenever the loading changes, during a voyage as well as between voyages. In the cargo ship of Table 3.1, G is 5.89 m above the baseline and B 3.42 m on departure; on arrival, with 471 t of fuel, diesel oil, fresh water and stores used, G has risen to 6.13 m and B, at the equivalent even-keel draught of 6.034 m, has fallen to 3.24 m. A heel moves B towards the immersed side, by an amount that depends on the shape of the waterplane, and whether it moves far enough to pass the vertical through G is the question of the metacentre. We begin Chapter 4 with the righting lever that this movement produces, and find there, for this ship, the height of G above which it cannot stay upright.
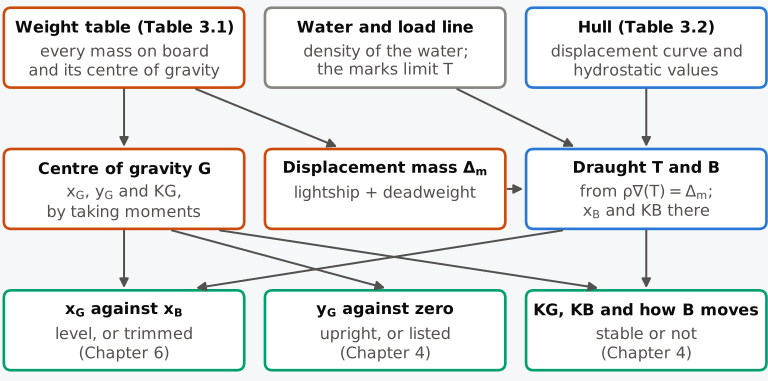
Figure 3.15 From the weights and the hull to the floating ship, and the chapters where each question is answered.
Predict 3.3. Take the masses and longitudinal positions of Table 3.1, but suppose the weights were stowed so that KG came out at 5.0 m in one condition and at 7.0 m in another. Do the two conditions float at different draughts or trims? What could differ between them?
Summary
A ship floats because the pressure of the water on its hull adds up to an upward force equal to the weight of the water displaced, acting through the centroid of the displaced volume. It floats in equilibrium when that force equals its weight and the two act along one vertical. The displacement mass is the lightship mass plus the deadweight, and the centre of gravity is found by taking moments of every item about three reference planes.
The draught is read from the displacement curve. For a small change the TPC gives the sinkage, and for a large change the curve must be used; the sinkage is parallel only for a mass placed over F. In water of another density the ship sinks or rises; going from sea water at 1.025 t/m³ into fresh water at 1.000 t/m³, a wall-sided ship sinks by exactly the fresh water allowance of the Load Line Convention, and the dock water allowance interpolates it linearly for water in between, overstating the sinkage slightly.
The displacement of a ship afloat is found from its draughts read on both sides at the marks, after allowing for hog or sag and for the density of the water. For a parabolic deflection of the keel, the mean of means makes the allowance for hog or sag approximately.
The load line mark fixes the deepest waterline for each zone, season and water, and with it the reserve buoyancy that the ship keeps. Each of the three ideas behind Plimsoll’s mark in the prologue, that a limit on draught is a limit on weight, that the meaning of the mark depends on the density of the water and that its height below the deck fixes the reserve buoyancy, therefore follows from the two conditions of equilibrium and the volumes of the hull. In practice, these results lead to six rules:
- keep a weight table in which every item, added or removed, has its own row;
- measure longitudinal positions from one perpendicular, which keeps nearly all of them positive;
- use the TPC only for changes small enough that the waterplane does not change, and the displacement curve otherwise;
- add the shell and appendages to the moulded volume before comparing a ship’s weight with its draughts;
- use the density of the water in which the ship actually floats, measured where and when the draughts are read;
- read the draughts on both sides at all three marks, and allow for hog or sag before entering the tables.
Notes on the data
Series 60. Values for the Series 60 hull are computed from the Series 60 surface of Sec. 1.5.5, built through Todd’s offsets47, a bare moulded hull with its deck at 1.5 times the design draught.
The cargo ship. The ship of Table 3.1 and Fig. 3.5 is illustrative. Its arrangement, weights and loading were chosen to be typical of a general cargo ship of its size; they are not data for a real ship.
Regulations. The Load Line Convention and SOLAS are summarized here from their consolidated texts19,32 for teaching. For a real ship, the texts in force and the Administration’s interpretation of them govern.
Exercises
Under each exercise, “Show full solution” opens its worked solution and, where the exercise asks for numbers, “Show answers” its short answers. Several exercises, marked as such, are adapted from Attwood18 (public domain). Use = 1.025 t/m³ for sea water, 1.000 t/m³ for fresh water and = 9.81 m/s².
3.1 A steel tube 10.5 m long and 4.8 m in outside diameter, closed at its ends by plates light enough to be neglected, floats in sea water with its axis in the surface. Taking the density of steel as 7.85 t/m³ and treating the shell as thin, find its thickness. How far does the tube sink when it is towed into fresh water? Compare the exact answer with the wall-sided sinkage. Adapted from Attwood18.
3.2 A cylinder 150 m long and 6.0 m in diameter floats in sea water with its axis in the surface. Find its mass, and the mass that must be removed for it to float in fresh water with its axis still in the surface. Adapted from Attwood18.
3.3 A ship leaves a river port, where the water is fresh, and enters the sea. To bring the ship back to its draught in the river, 180 t of water ballast must be taken on board. Find the displacement mass in the river. Adapted from Attwood18.
3.4 The half-breadths of a waterplane, 4.5 m apart, are 0.06, 1.10, 2.26, 3.05, 3.35, 3.26, 2.83, 1.98 and 0.61 m. Find the area of the waterplane and the TPC in sea water, the mass that must be removed to lighten the vessel by 9 cm, and the sinkage when 5 t is placed over the centre of flotation. State the assumptions you make. Adapted from Attwood18.
3.5 A barge has the following TPC in sea water at waterlines 0.6 m apart, from the keel upwards: 2.61, 4.35, 5.42, 6.24, 6.90, 7.40 and 7.78 t/cm. Find its displacement mass at a draught of 3.6 m, and the mass needed to take it from a draught of 3.0 m to 3.6 m, by the five-eight rule. Adapted from Attwood18.
3.6 A ship 150 m long and 22 m wide floats at its summer draught of 8.4 m, where = 0.72 and = 0.83. Find its displacement mass and TPC in sea water, its fresh water allowance from the displacement and the TPC and from the coefficients, and the draught at which it would float in fresh water if it were wall-sided. Compare the allowance with .
3.7 In its departure condition the Series 60 cargo ship has a displacement mass of 7707 t, and the moulded calculation gives a draught of 6.367 m, where the TPC is 14.30 t/cm; at its summer draught the moulded displacement mass is 7901.8 t. Its shell plating and appendages add 0.8 % to its moulded volume. Find (a) by how much it floats higher than the moulded calculation gives and (b) how much more deadweight it can carry at its summer draught. Why is this allowance a smaller percentage for a larger, geometrically similar ship?
3.8 A vessel displaces 5000 t at the load waterline, where its centre of buoyancy is 3.05 m below the waterline. In the light condition the vessel displaces 2000 t, and the layer between the light and load waterlines, 3.66 m thick, has its centroid 1.83 m below the load waterline. How far below the light waterline is the centre of buoyancy in the light condition? Adapted from Attwood18.
3.9 A long vessel of V-shaped section, as wide at the waterline as twice its draught, floats in fresh water at a draught of 3.66 m with its keel just touching a bed of mud of relative density 2.0. The tide then falls by 1.83 m. Treating the mud as a fluid, find how far the vessel sinks into it. Adapted from Attwood18.
3.10 On arrival, the Series 60 cargo ship whose departure condition is given in Table 3.1 has 2 t of stores, 19 t and 18 t of fuel oil in the port and starboard tanks, 4 t of diesel oil and 11 t of fresh water. The tank tables put the centres of these smaller quantities at = 56.31 m, = 2.94 m and −2.93 m, = 0.07 m for the fuel oil, = 35.11 m, = 0.05 m for the diesel oil and = 6.70 m, = 3.64 m for the fresh water; the stores stay where they were, and everything else in that table is unchanged. Find the displacement mass and the position of G, the equivalent even-keel draught from Table 3.2, and how far G lies forward of B at that draught. Which way will the ship trim?
3.11 Six loads are to be placed on a ship: 20 t, 45 t and 15 t at 30.5 m, 24.4 m and 12.2 m forward of amidships, and 60 t, 40 t and 30 t at 15.2 m, 24.4 m and 33.5 m aft of amidships. Find the single mass and position equivalent to them. The ship, 110 m between perpendiculars, displaces 3790 t before loading, with G 0.50 m forward of amidships; find its new displacement mass and the new position of G, both relative to amidships and as measured from the AP. Adapted from Attwood18.
3.12 A ship has vertical sides above its waterline and a vertical prismatic coefficient below it. Show that its reserve buoyancy is , with the freeboard. Find the freeboard, as a fraction of the draught, that gives it a reserve buoyancy of one third of the displaced volume, the proportion that the rule of 1835 gives a box, when = 0.845.
3.13 A ship of length 90 m has a summer draught of 5.40 m, measured from the top of the keel, and a summer freeboard of 1.250 m; at the summer load waterline its displacement mass is 4200 t and its TPC 10.6 t/cm. Find its fresh water allowance and the freeboards of its T, W, WNA, F and TF lines. Which is higher, the F line or the T line, and why?
3.14 A ship whose fresh water allowance is 150 mm and whose TPC in sea water is 22.0 t/cm floats at a berth in water of density 1.012 t/m³. It has a small list, with the upper edge of its summer load line 55 mm above the water to port and 25 mm above it to starboard. How much more cargo can it load if it is to float at its summer mark in sea water? What would the answer be if the TPC in sea water were used?
3.15 A bulk carrier is surveyed before and after loading at a berth where the density of the water is 1.0185 t/m³. Before loading, the hydrostatic tables, which are for sea water of 1.025 t/m³, give a displacement mass of 8450 t at the corrected draught, and the soundings show 2350 t of ballast, 520 t of fuel and 210 t of fresh water. After loading, the tables give 24,980 t, with 40 t of ballast, 505 t of fuel and 200 t of fresh water. The lightship mass is 5180 t. Find the constant and the mass of cargo loaded. With a TPC of 40 t/cm in the water at the berth, what fraction of the cargo is an error of 1 cm in the corrected draught of the final survey?
3.16 The TPC in sea water of a ship at waterlines 0.9 m apart, from the load waterline downwards, are 12.48, 12.00, 11.34, 10.48, 9.35, 7.80 and 5.16 t/cm. Neglecting the small volume below the lowest waterline, find the displacement mass at the load waterline in sea water and in fresh water, and the depth of the centre of buoyancy below the load waterline. Then find the mass that must be removed to lighten the ship by 0.70 m, integrating a parabola through the first three values of the TPC, and check it against an upper bound. Adapted from Attwood18.
3.17 Show that the moment about the origin of the pressure forces on the hull, , equals , where is the position of B, so that the buoyancy acts along the vertical through B. Close the surface with the waterplane and apply the divergence theorem to each component, as was done for the force itself.
Show full solution
In index form. With the permutation symbol, the Kronecker delta, and summation over repeated indices, the -th component of is .
The divergence theorem. On the closed surface formed by and the waterplane, where ,
The two terms. The first term vanishes because , and , so
Comment. The moment of the water’s forces is minus this, , which is the moment of the buoyancy placed at B.
3.18 The Series 60 cargo ship is loading at a fresh-water berth and floats at a mean draught of 6.00 m. From its deadweight scale, Table 3.4, find its deadweight now. It will use 40 t of fuel and fresh water before it reaches the sea, where it must float at its summer draught. How much more may it load, and to what draught may it load at the berth?
3.19 A hydrometer has a mass of 60 g, and its bulb, below a uniform stem of cross-section 0.50 cm², has a volume of 55.0 cm³. What length of the stem is immersed in fresh water and in sea water of 1.025 t/m³, and where on the stem is the mark for 1.012 t/m³? Are equal steps of density equally spaced on the stem?
3.20 A box barge 60 m long and 12 m wide floats in sea water at draughts of 2.80 m forward, 2.90 m aft and 2.81 m amidships. Is it hogged or sagged, and by how much? Find its displacement mass with the parabolic deflection of the keel and with the mean of means, and compare the two.
3.21 A deck barge with vertical sides, whose waterplane is 40 m long and 8 m wide, carries 120 t of steel billets of density 7.85 t/m³ in a lock chamber 100 m long and 12 m wide, filled with fresh water. The billets are pushed over the side and sink to the floor of the lock, and the barge floats clear of the floor throughout. Decide first whether the water level in the lock rises or falls. Then find the change of level, and how far the barge rises relative to the water and relative to the floor of the lock.
Symbols introduced in this chapter
| Symbol | Meaning | Unit |
|---|---|---|
| deadweight coefficient; not the drag coefficient of the ITTC list | – | |
| DWT | deadweight | t |
| DWA, FWA | dock water allowance; fresh water allowance | mm or cm |
| force of the water on the hull | N (kN) | |
| , | summer freeboard (deck line to the centre of the ring); summer draught (top of keel to the centre of the ring) | m |
| GT, NT | gross and net tonnage (pure numbers) | – |
| KG, | height of G above the baseline | m |
| , | coefficient and total moulded volume of enclosed spaces in the gross tonnage | –; m³ |
| factor of the hog or sag in the mean draught | – | |
| shell and appendage allowance, as a fraction of the moulded volume | – | |
| , | unit vector upwards; unit normal out of the hull | – |
| ; , , | mass of an item on board; coordinates of its centre of gravity | t; m |
| lightship mass | t | |
| breadth of the waterline at | m | |
| , , | immersed length of a hydrometer’s stem; volume of its bulb; cross-section of its stem; Sec. 3.5 and Exercise 3.19 only | m; m³; m² |
| pressure of the water above atmospheric | Pa (kPa) | |
| , | position vector; position of B | m |
| TPC | tonnes per centimetre immersion | t/cm |
| transverse position of G | m | |
| net upward force in heave | N (kN) | |
| change of draught; sinkage | m or cm | |
| , , | displaced volume up to the waterline at height ; up to the deck; reserve buoyancy | m³ |
| , | densities of the water before and after a change | t/m³ |
| sag of the hull, , negative for a hog | m |
Corrections
Corrections to version 1.0, released on 3 November 2026, with their dates.
3 November 2026. Secs. 3.2.1, 3.2.2 and 3.8.2, the Notes on the data and the reference list cite SOLAS in its consolidated edition of 2024, in place of that of 2020.
4 November 2026. Sec. 3.2.1 cites the circular itself for the inclusion of fixed fire-fighting media in lightweight, replacing an unverified editorial locator in the consolidated SOLAS edition.
5 November 2026. The prologue cites section 6 of the Merchant Shipping Act 1875 for the disc, in place of section 9, and section 5 for the deck lines; the Act of 1875 already required the owner to state the distance of the disc below the deck lines.
5 November 2026. Example 3.5 and Solution 3.10 say that the draught they give lies at the centre of flotation of the even-keel waterline, and where that centre lies.
5 November 2026. Sec. 3.8.1 no longer attributes to its source the difference of about 0.001 t/m³ between the density in vacuo and the apparent density in air, which follows from the buoyancy of the air.
6 November 2026. Sec. 3.1.3 is headed “Flotation of a steel ship”, in place of “Why a steel ship floats”. Its text is unchanged.
References
- Plimsoll, S. (1873). Our seamen: An appeal (Popular ed.). Virtue & Co. (Public domain.) https://archive.org/details/ourseamenappeal00plim Cited: ↑ p. 8 · ↑ contents · ↑ p. 52 · ↑ pp. 40–42
- Royal Museums Greenwich. (n.d.). Samuel Plimsoll and ship safety. Retrieved October 8, 2026, from https://www.rmg.co.uk/stories/maritime-history/samuel-plimsoll-ship-safety Cited: ↑
- LR Foundation. (2020, April 15). The Plimsoll line. Lloyd’s Register Foundation Heritage & Education Centre. https://heritage.lrfoundation.org.uk/blogs/the-plimsoll-line Cited: ↑
- The Edinburgh Gazette. (1873, April 4). [Notice of the commission to inquire into the alleged unseaworthiness of British registered ships, Whitehall, 31 March 1873] (Issue 8360, p. 205). https://www.thegazette.co.uk/Edinburgh/issue/8360/page/205 Cited: ↑
- The Unseaworthy Ships’ Commission. (1873). The Lifeboat, 8(90). https://lifeboatmagazinearchive.rnli.org/volume/08/90/the-unseaworthy-ships-commission?page=582 Cited: ↑
- UK Parliament. (1874, June 24). Merchant Shipping Survey Bill: Second reading (HC Deb vol. 220, cols. 344–384). Hansard. https://api.parliament.uk/historic-hansard/commons/1874/jun/24/bill-11-second-reading Cited: ↑ cols. 374, 383 · ↑ col. 350
- UK Parliament. (1875a, July 22). Parliament: Public business; Merchant Shipping Acts Amendment Bill; Agricultural Holdings (England) Bill (HC Deb vol. 225, cols. 1820–1822). Hansard. https://api.parliament.uk/historic-hansard/commons/1875/jul/22/question-ministerial-statement Cited: ↑ col. 1821
- UK Parliament. (1875b, July 22). Parliament: Breach of order (Mr. Plimsoll) (HC Deb vol. 225, cols. 1822–1829). Hansard. https://api.parliament.uk/historic-hansard/commons/1875/jul/22/parliament-breach-of-order-mr-plimsoll Cited: ↑ cols. 1822–1825
- UK Parliament. (1875d, July 29). Parliament: Breach of order (Mr. Plimsoll) (HC Deb vol. 226, cols. 178–180). Hansard. https://api.parliament.uk/historic-hansard/commons/1875/jul/29/parliament-breach-of-order-mr-plimsoll Cited: ↑ cols. 178–179
- UK Parliament. (1875c, July 27). Parliament: Arrangement of public business; Merchant Shipping Acts Amendment (No. 2) Bill (HC Deb vol. 226, cols. 92–99). Hansard. https://api.parliament.uk/historic-hansard/commons/1875/jul/27/questions Cited: ↑ col. 92
- Merchant Shipping Act 1875, 38 & 39 Vict. c. 88. Reprinted in New Zealand Gazette, 1876, No. 3, 39–41. https://gazette.howison.co.nz/nzg/1876/issue/3/page/39 Cited: ↑ ss. 5–6
- The Merchant Shipping Act, 1876. (1876, November). The Lifeboat, 9(102), 609. https://lifeboatmagazinearchive.rnli.org/volume/09/102/the-merchant-shipping-act-1876 Cited: ↑
- Marine Review. (1921, June). [Unsigned article on British and foreign freeboard regulations]. Marine Review, 271–273. https://images.maritimehistoryofthegreatlakes.ca/125069/page/24 Cited: ↑
- Merchant Shipping Act 1894, 57 & 58 Vict. c. 60, ss. 438, 443. https://www.irishstatutebook.ie/1894/en/act/pub/0060/sec0438.html Cited: ↑ ss. 438, 443
- Biran, A., & López-Pulido, R. (2014). Ship hydrostatics and stability (2nd ed.). Butterworth-Heinemann. Cited: ↑ Section 2.2.1 · ↑ Section 2.2.1 · ↑ Section 2.3 · ↑ Section 2.4 · ↑ Section 4.3
- Heath, T. L. (1921). A history of Greek mathematics: Vol. 2. From Aristarchus to Diophantus. Clarendon Press. (Public domain.) Cited: ↑ p. 92
- Nowacki, H., & Ferreiro, L. D. (2003). Historical roots of the theory of hydrostatic stability of ships. In Proceedings of the 8th International Conference on the Stability of Ships and Ocean Vehicles (STAB 2003) (pp. 1–30). Escuela Técnica Superior de Ingenieros Navales. https://shipstab.org/files/Proceedings/STAB/STAB2003/Papers/Paper%2001.pdf Cited: ↑ p. 4 · ↑ pp. 4–6 · ↑ p. 6 · ↑ p. 8 · ↑ p. 9
- Attwood, E. L. (1899). Text-book of theoretical naval architecture. Longmans, Green, and Co. (Public domain.) Cited: ↑ pp. 21–22 · ↑ pp. 160–161 · ↑ · ↑ ch. I, Ex. 53 · ↑ ch. I, Ex. 33 · ↑ ch. I, Ex. 31 · ↑ ch. I, Exs. 21–22 · ↑ ch. I, Ex. 38 · ↑ ch. II, Ex. 18 · ↑ ch. II, Ex. 21 · ↑ ch. II, Ex. 1 · ↑ ch. II, Ex. 8
- IMO. (2024). SOLAS: Consolidated edition 2024 (Sales No. IH110E). International Maritime Organization. Cited: ↑ reg. II-1/2.21 · ↑ reg. II-1/2.20 · ↑ reg. II-1/5.1 · ↑ reg. II-1/5.5 · ↑ reg. II-1/5.4 · ↑
- IMO. (2020). International Code on Intact Stability, 2008 (2020 ed.). International Maritime Organization. Cited: ↑ Introduction, para. 2.23 · ↑ Introduction, paras 2.22 and 2.24
- IMO. (2019, July 4). Unified interpretations of SOLAS chapters II-1 and safe return to port requirements for flooding detection systems (MSC.1/Circ.1539/Rev.1). International Maritime Organization. Circular reproduced in ClassNK Technical Information TEC-1191. https://www.classnk.or.jp/hp/pdf/tech_info/tech_img/T1191e.pdf Cited: ↑ annex, para. 1
- Moore, C. S. (2010). Intact stability (J. R. Paulling, Ed.; Principles of Naval Architecture Series). Society of Naval Architects and Marine Engineers. Cited: ↑ Section 2.2 · ↑ Table 1 · ↑ Section 2.2 · ↑ Table 1 · ↑ Section 2.3 · ↑ Table 2 · ↑ Section 2.3 · ↑ pp. 56–57 · ↑ p. 58 · ↑ p. 58 · ↑ p. 58 · ↑ p. 58
- Barrass, C. B., & Derrett, D. R. (2006). Ship stability for masters and mates (6th ed.). Butterworth-Heinemann. Cited: ↑ p. 290 · ↑ p. 16 · ↑ p. 58 · ↑ p. 21 · ↑ pp. 26–27 · ↑ pp. 283–284 · ↑ p. 467 · ↑ pp. 467–468 · ↑ pp. 467–468 · ↑ p. 40 · ↑ pp. 382–383 · ↑ pp. 291, 469
- Tupper, E. C. (2013). Introduction to naval architecture (5th ed.). Butterworth-Heinemann. Cited: ↑ ch. 2 · ↑ p. 56 · ↑ p. 17
- IMO. (n.d.-b). International Convention on Tonnage Measurement of Ships. Retrieved October 8, 2026, from https://www.imo.org/en/about/conventions/page/international-convention-on-tonnage-measurement-of-ships.aspx Cited: ↑
- International Convention on Tonnage Measurement of Ships, 1969, adopted 23 June 1969, in force 18 July 1982. International Maritime Organization. Cited: ↑ Annex I, reg. 3 · ↑ Annex I, reg. 4
- Hamlin, N. A. (1988). Ship geometry. In E. V. Lewis (Ed.), Principles of naval architecture: Vol. I. Stability and strength (2nd rev., ch. I). Society of Naval Architects and Marine Engineers. Cited: ↑ Section 8.10 · ↑ Section 8.10 · ↑ Section 5
- Fuller, H. J. (2025). “The whole history of this ill-fated vessel”: HMS Captain, the American Civil War, and the mid-Victorian struggle for naval superiority. International Journal of Naval History, 18(1). https://ijnh.seahistory.org/the-whole-history-of-this-ill-fated-vessel-hms-captain-the-american-civil-war-and-the-mid-victorian-struggle-for-naval-superiority/ Cited: ↑
- UK Parliament. (1871, June 16). Her Majesty’s ship “Captain”: Observations (HL Deb vol. 207, cols. 122–135). Hansard. https://api.parliament.uk/historic-hansard/lords/1871/jun/16/observations Cited: ↑ col. 123
- UK P&I Club. (2023). Draught surveys. In Carefully to carry (Consolidated ed., ch. 16). https://www.ukpandi.com/fileadmin/uploads/ukpandi/Documents/uk-p-i-club/carefully-to-carry/2023/UKPI_Carefully_to_Carry_2023_16.pdf Cited: ↑ ch. 16 · ↑ ch. 16 · ↑ ch. 16 · ↑ ch. 16 · ↑ ch. 16 · ↑ ch. 16 · ↑ ch. 16 · ↑ ch. 16 · ↑ ch. 16
- ITTC. (2024). Fresh water and seawater properties (Recommended Procedures and Guidelines 7.5-02-01-03, Rev. 03). International Towing Tank Conference. https://www.ittc.info/media/11764/75-02-01-03.pdf Cited: ↑ Tables 1 and 3 and appendix
- IMO. (2018). Load lines: Consolidated edition 2018. International Maritime Organization. Cited: ↑ Annex I, reg. 40(7) · ↑ Annex I, reg. 40(8) · ↑ Annex I, reg. 3(9) · ↑ Annex I, reg. 4 · ↑ Annex I, reg. 27 · ↑ Annex II · ↑ art. 12(1) · ↑ Annex I, reg. 40 · ↑ Annex I, reg. 6(7) · ↑ art. 3(2) · ↑ Annex I, reg. 39 · ↑ Annex I, regs 3 and 39(1) · ↑ art. 12(2) · ↑ art. 12(3) · ↑ art. 19 · ↑ art. 14 · ↑
- Office of the Historian. (n.d.). Foreign relations of the United States, 1930, Volume I, chapter 10: International Load Line Conference. U.S. Department of State. Retrieved October 8, 2026, from https://history.state.gov/historicaldocuments/frus1930v01/ch10 Cited: ↑
- New Zealand Ministry of Foreign Affairs and Trade. (n.d.). International Load Line Convention [Treaty record]. Retrieved October 8, 2026, from https://www.treaties.mfat.govt.nz/search/details/t/1057/778 Cited: ↑
- IMO. (n.d.-a). International Convention on Load Lines. Retrieved October 8, 2026, from https://www.imo.org/en/about/conventions/pages/international-convention-on-load-lines.aspx Cited: ↑
- Tractatenblad. (2006). Tractatenblad van het Koninkrijk der Nederlanden, 2006(20) [Text of Resolution MSC.143(77)]. https://zoek.officielebekendmakingen.nl/trb-2006-20.html Cited: ↑ Annex I, reg. 2(7)
- UNECE. (1992). Code of uniform standards and procedures for the performance of draught surveys of coal cargoes (ECE/ENERGY/19). United Nations Economic Commission for Europe. https://digitallibrary.un.org/record/168125 Cited: ↑
- West of England P&I Club. (n.d.). Inaccuracies in draught surveys (Loss Prevention Bulletin). Retrieved October 10, 2026, from https://www.westpandi.com/getattachment/08717f3d-c72d-43f8-a872-3efcbf4345f9/loss-prevention-bulletins_inaccuracies-in-draught-surveys_v2_lr-1-.pdf Cited: ↑ · ↑
- ISO. (2008). Copper, lead and zinc ores and concentrates: Precision and bias of mass measurement techniques (ISO 12745:2008). International Organization for Standardization. Cited: ↑ cl. 4.1
- Zhang, B., Li, J., Tang, H., & Liu, X. (2024). Smart ship draft reading by dual-flow deep learning architecture and multispectral information. Sensors, 24(17), 5580. https://doi.org/10.3390/s24175580 Cited: ↑
- IMO. (2023). Unified interpretation of SOLAS chapter II-1 (MSC.1/Circ.1362/Rev.2, 14 July 2023; revokes MSC.1/Circ.1362/Rev.1). Text consulted as an attachment to Marine Department, Hong Kong, Merchant Shipping Information Note No. 63/2023 (2023). Retrieved October 14, 2026, from https://www.mardep.gov.hk/en/msnote/pdf/msin2363anx1.pdf Cited: ↑ annex, p. 5 · ↑ annex, p. 6, para. 1
- National Academies of Sciences, Engineering, and Medicine. (2018). Review of U.S. Coast Guard vessel stability regulations [Letter report]. The National Academies Press. https://doi.org/10.17226/25258 Cited: ↑
- Herbert Engineering Corp. (2017). NSMV phase 3 design: Lightship weight estimate (Document 2015-017-03-06). U.S. Maritime Administration. https://www.maritime.dot.gov/sites/marad.dot.gov/files/docs/national-defense/office-ship-operations/rrf/2611/lightship-weight-report.pdf Cited: ↑
- IMO. (2021). Amendments to the Protocol of 1988 relating to the International Convention on Load Lines, 1966 (Resolution MSC.491(104), adopted 8 October 2021). International Maritime Organization. Cited: ↑
- IMO. (2026). Amendments to the Protocol of 1988 relating to the International Convention on Load Lines, 1966 (Resolution MSC.591(111), adopted 21 May 2026). International Maritime Organization. Copy published by the Lithuanian Transport Safety Administration. https://ltsa.lrv.lt/public/canonical/1787556830/2291/MSC.591(111).pdf Cited: ↑
- IMO. (2016). Guidelines for the use of electronic certificates (FAL.5/Circ.39/Rev.2, 20 April 2016). International Maritime Organization. Cited: ↑
- Todd, F. H. (1963). Series 60: Methodical experiments with models of single-screw merchant ships (Report No. 1712). David Taylor Model Basin. https://apps.dtic.mil/sti/pdfs/AD0419990.pdf Cited: ↑ Table 3